Data Visualization:
Wellness Experience
The first phase of this project visualizes two weeks of self-tracked data to examine how wellness is experienced individually and compared between participants. The outcome is a poster set where each recorded wellness activity translates to a qualitative experience in the visual of a flower petal. The posters combine thoughtful data analysis with expressive design to communicate patterns, comparisons, and overall wellness experiences.
In the second phase, my participants’ data was translated into an interactive, physical installation, transforming the dataset into a tactile experience that invites user participation and explores how material and form shape the interpretation of wellness.
Phase One:
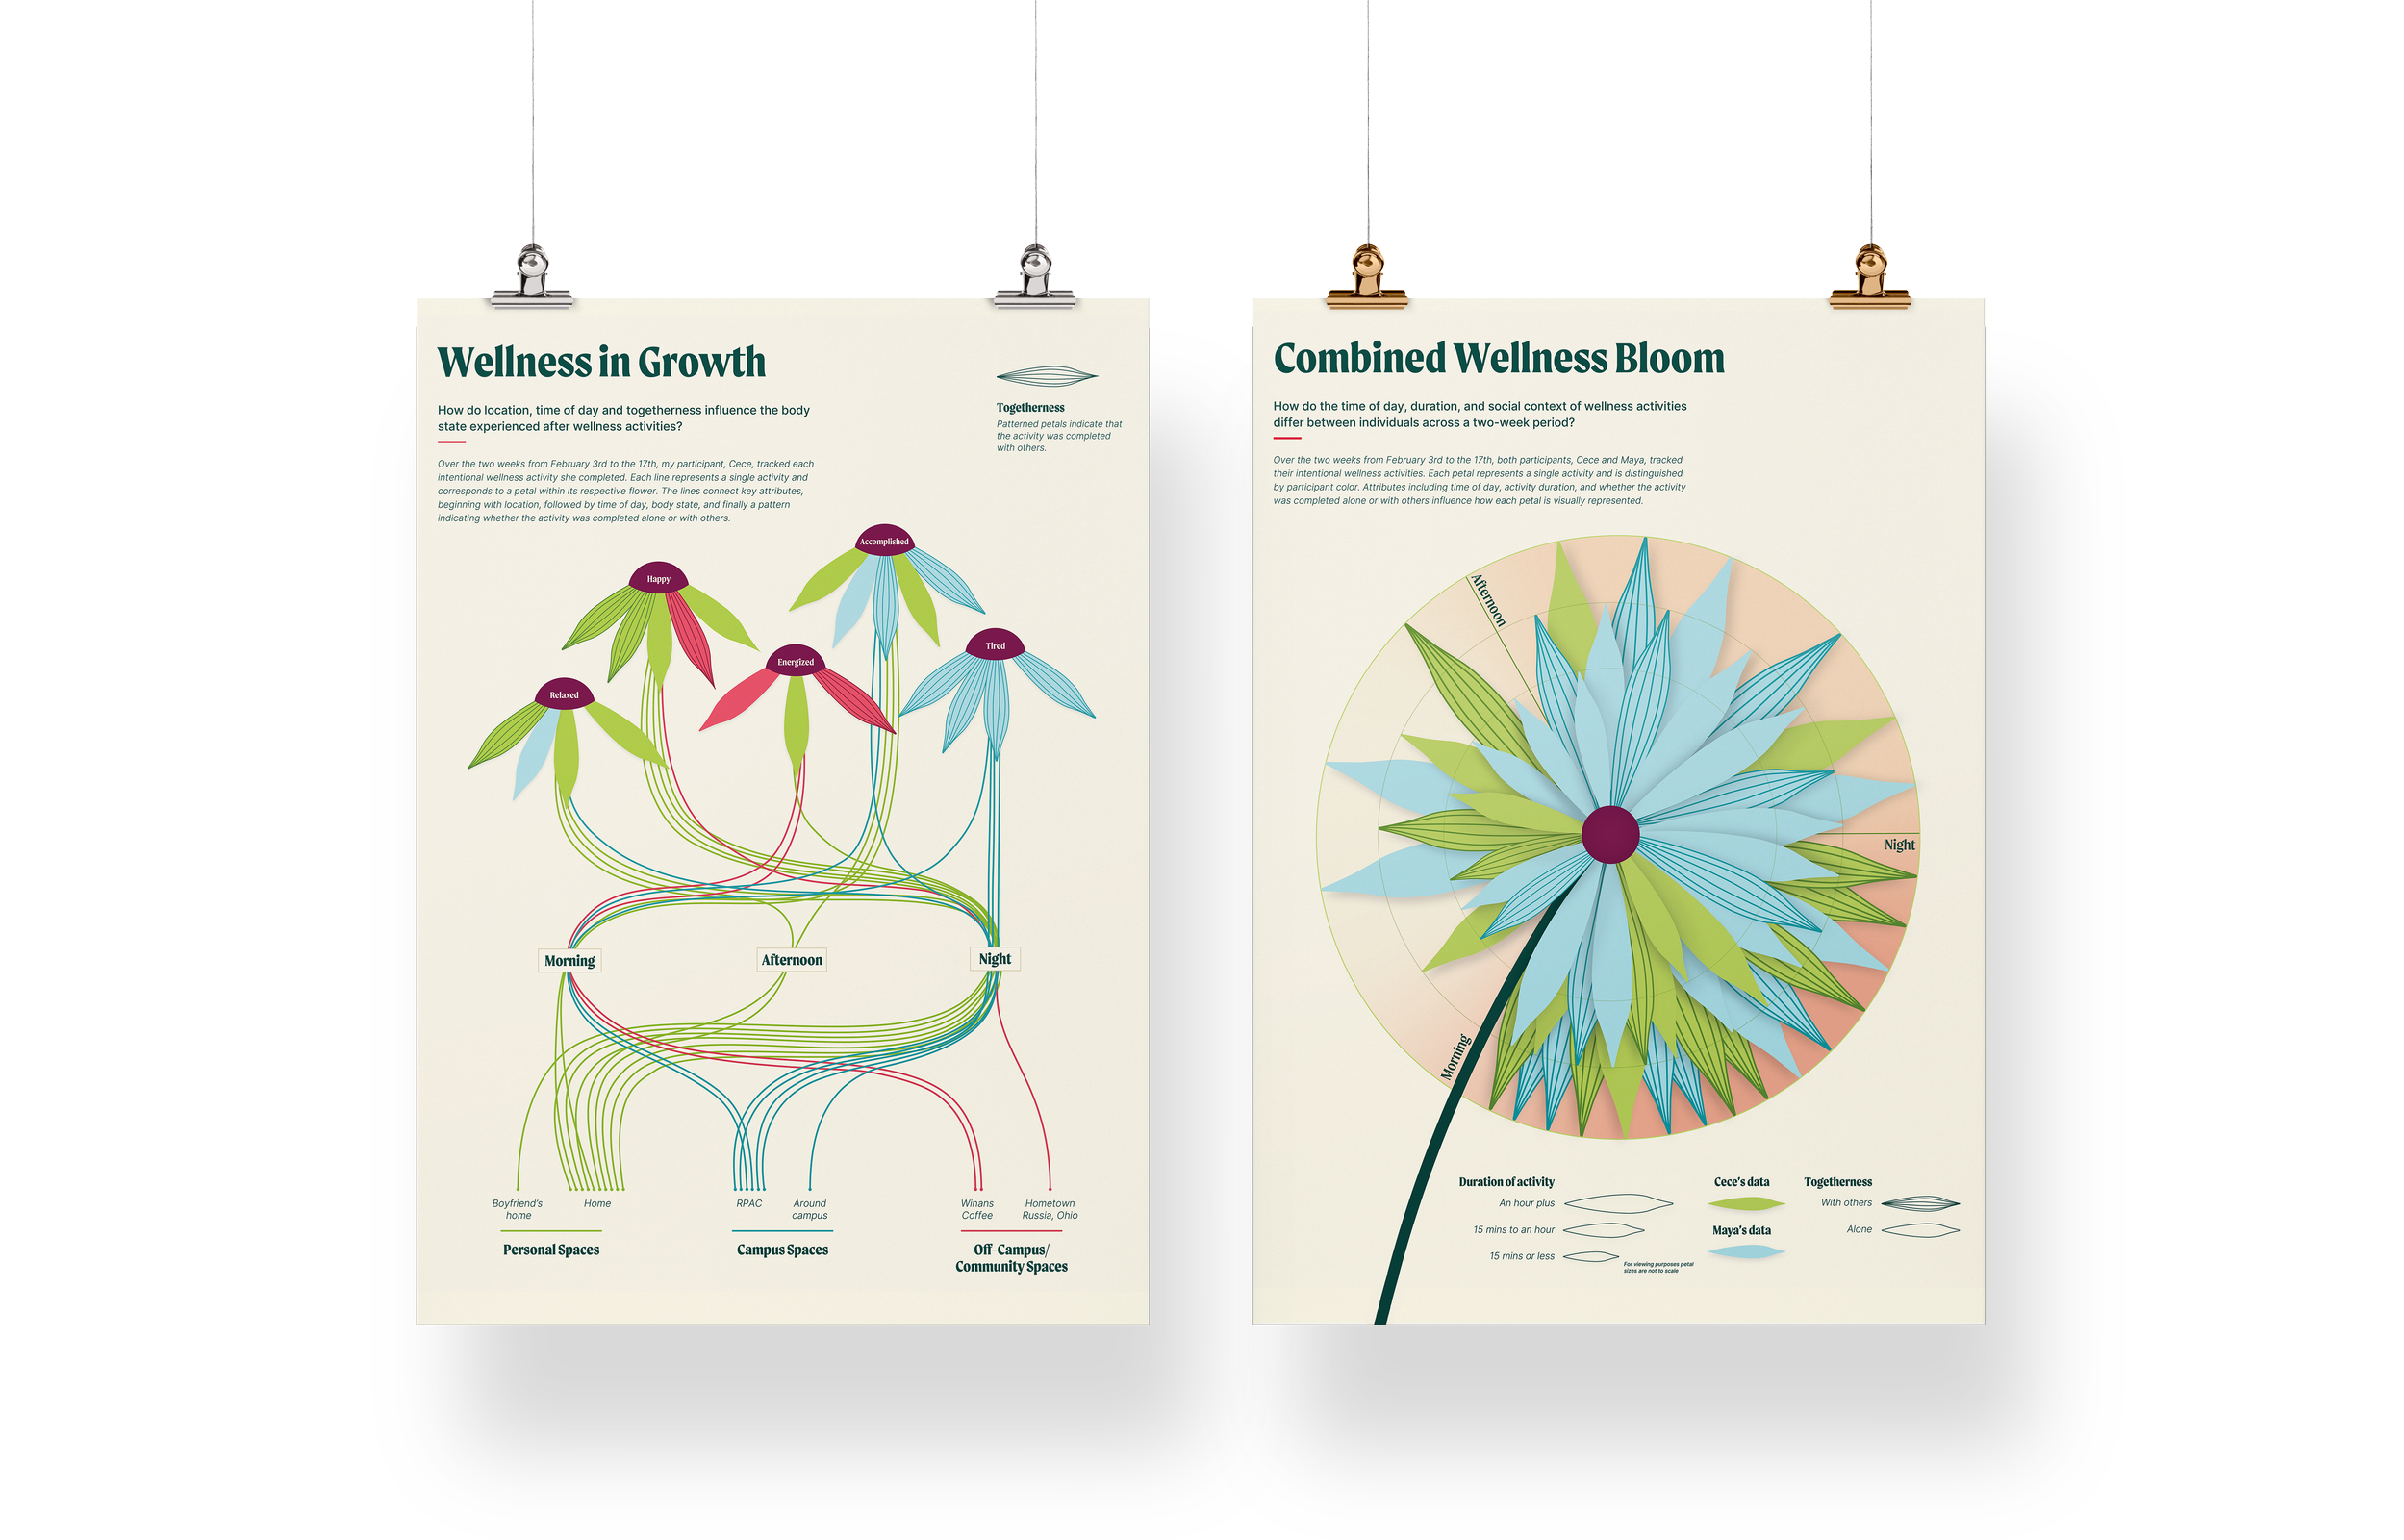
Wellness Experience Poster Set
A two-dimensional visualization of wellness experiences tracked over a two-week period.
Phase Two:
Interactive Wellness Activity
An interactive installation to visualize my participant’s data physically.
Data Collection
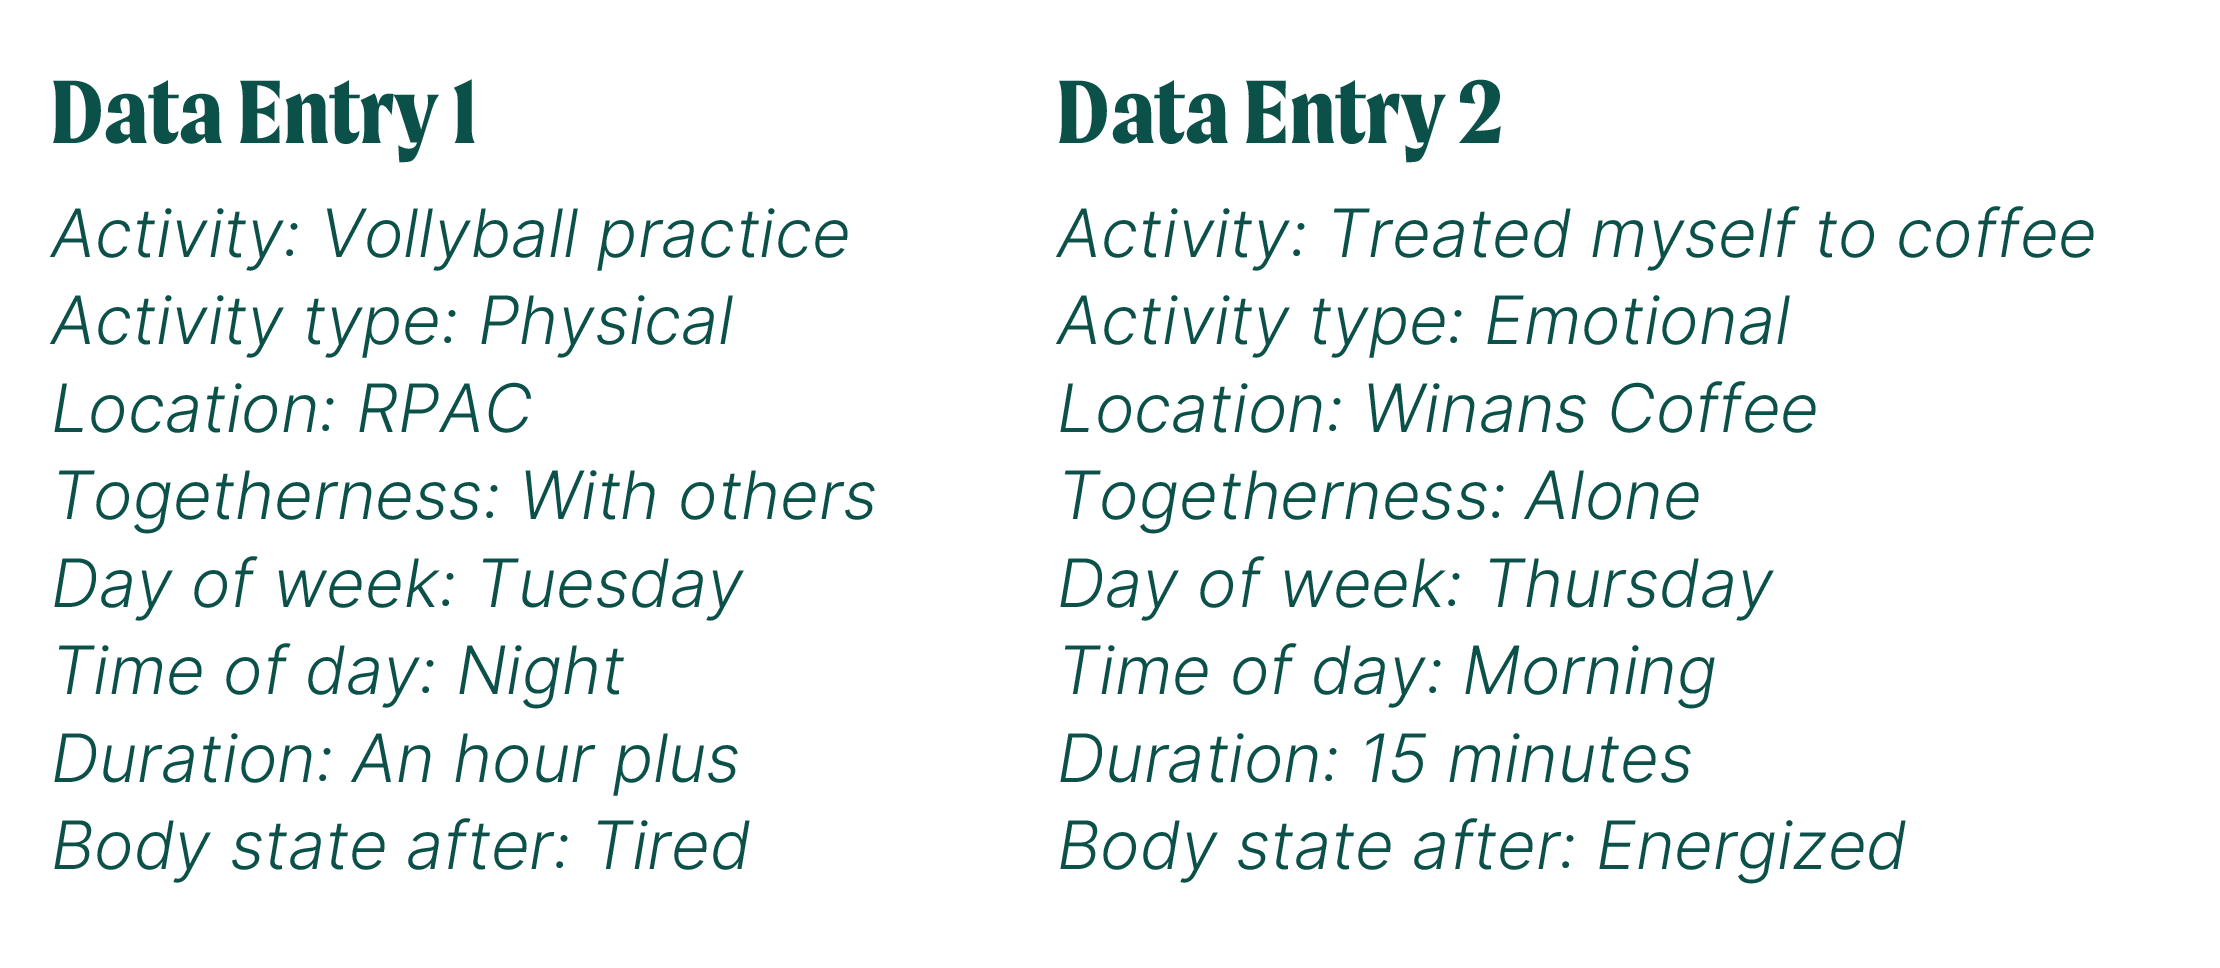
My participant, Cece, tracked each time she intentionally completed a wellness activity over the course of two weeks. A selection of Cece’s recorded entries is shown on the right.
Sketches and Ideation
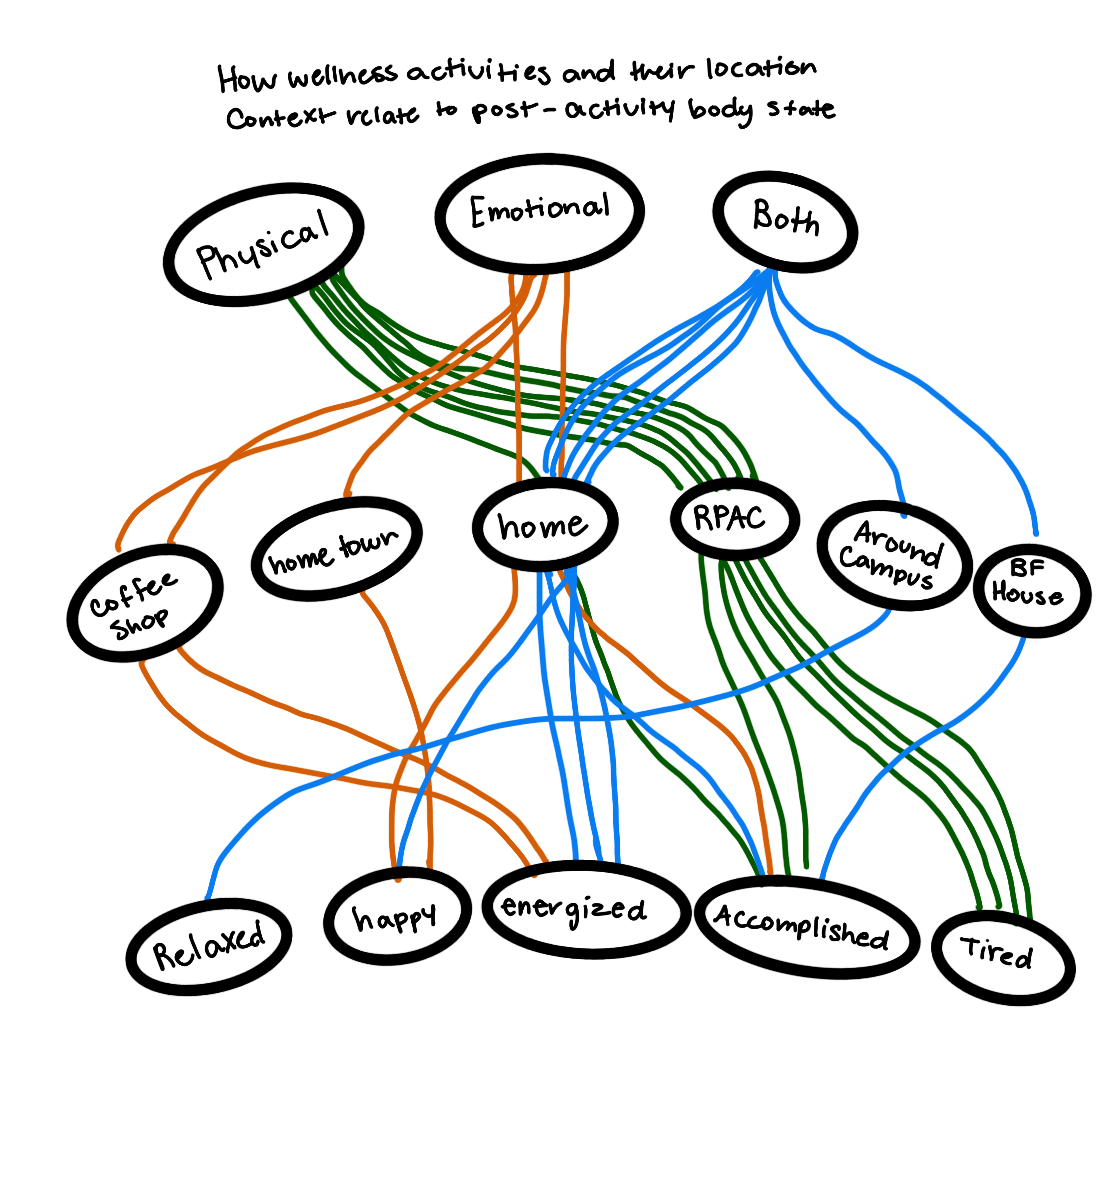
Concept 1
This concept is read from top to bottom and explores how the context of type of wellness activities and the location influence the body's state afterward. Although I moved forward with this flow-like chart, beginning the visualization with activity type context is confusing in contrast to the body state afterward.
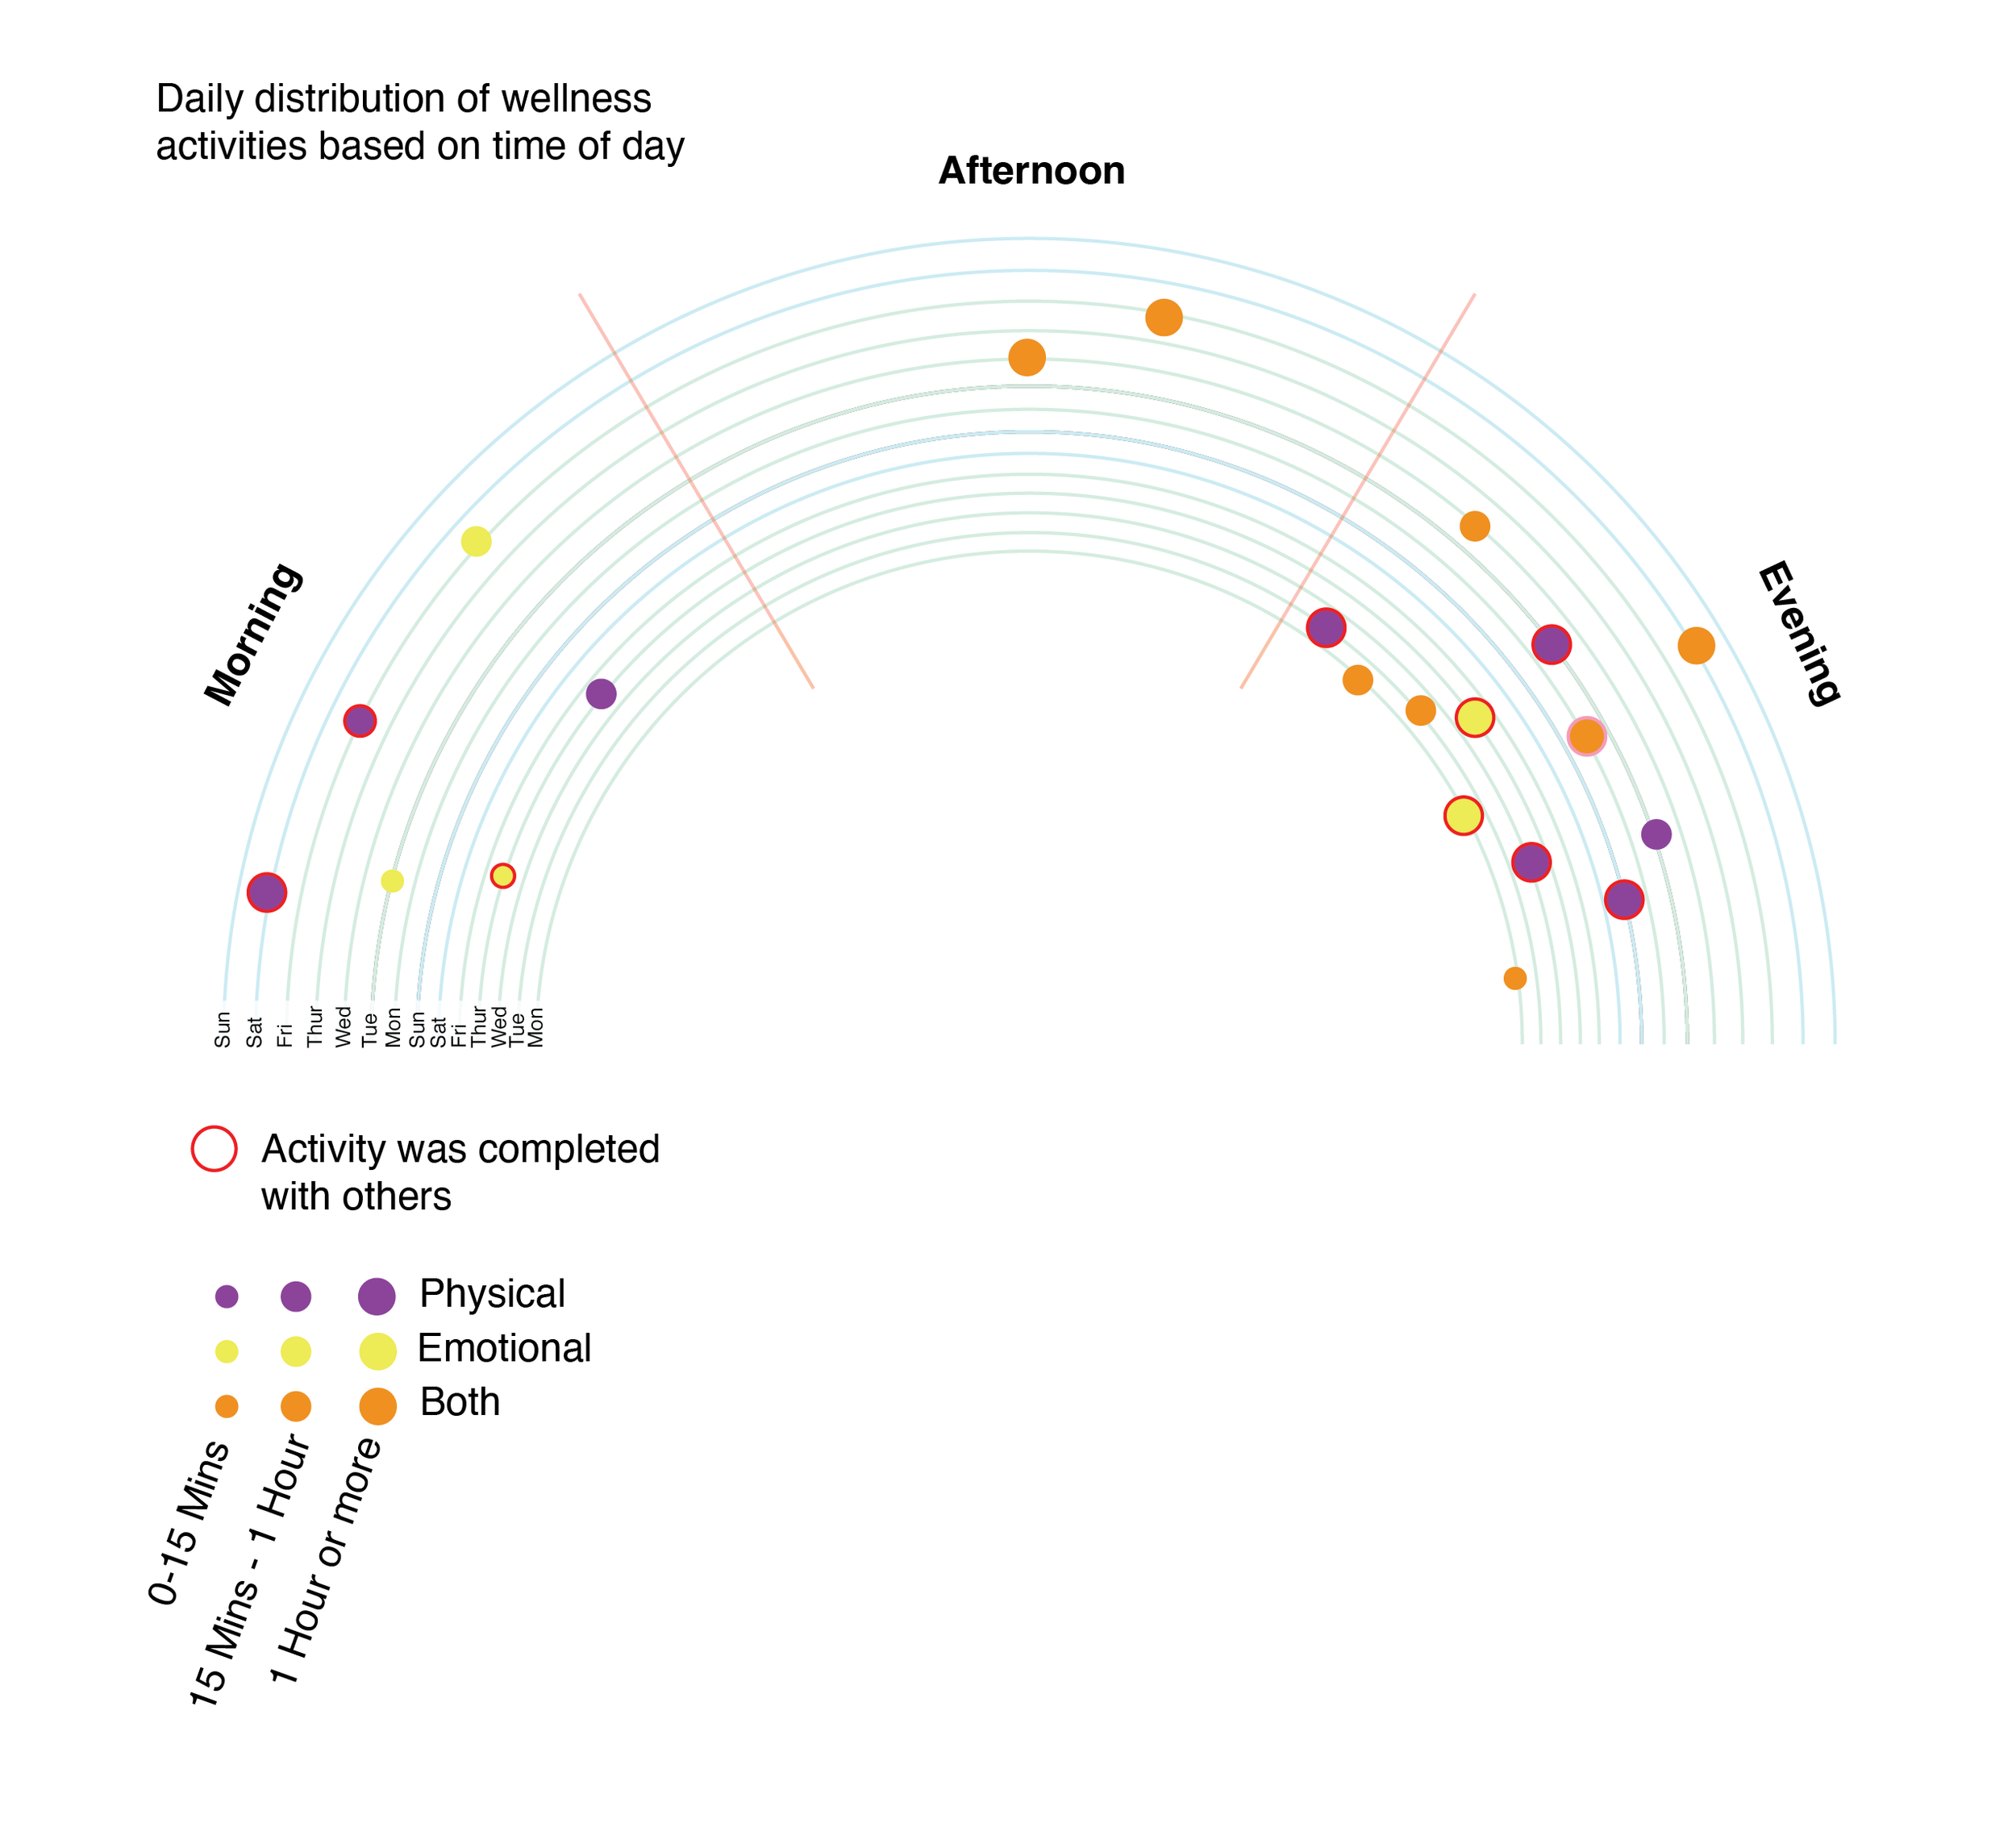
Concept 2
This simple concept visualizes the activity type, physical, mental, or both, and how many of those activities were completed with others. I did not move forward with this concept, but I did incorporate the flower petal aesthetic in both of my final posters.

Concept 3
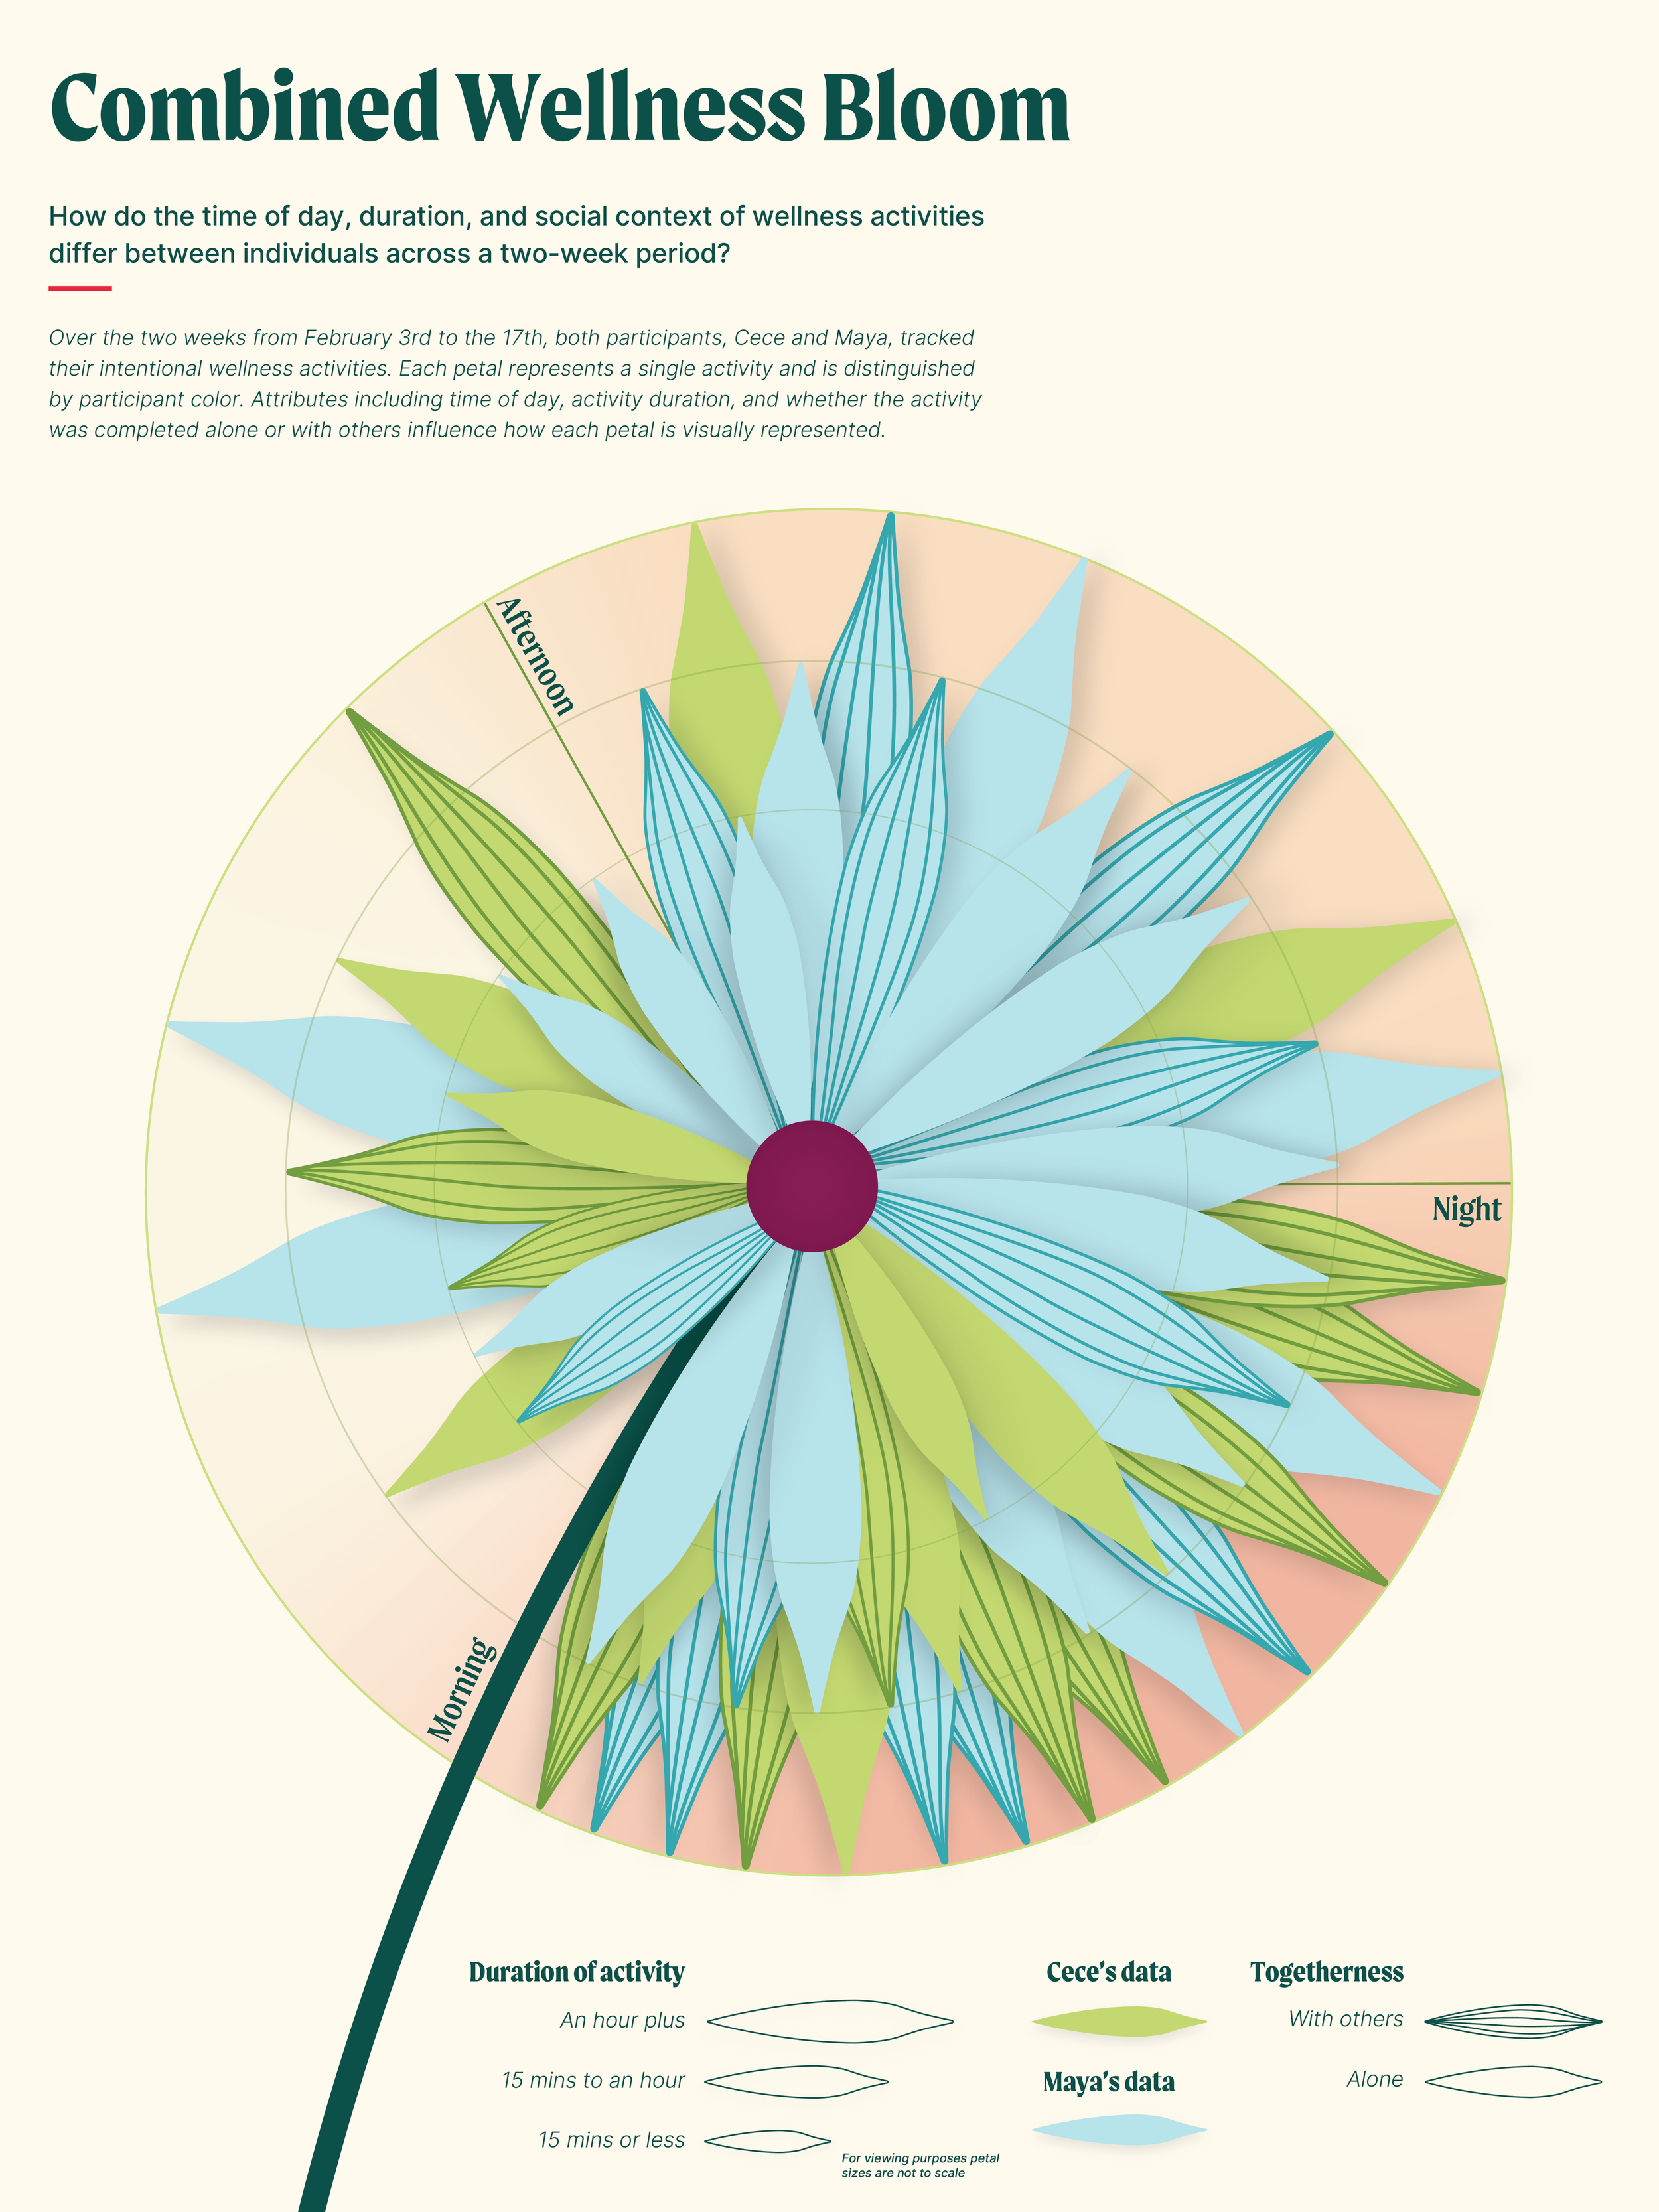
This concept explores the relationship between wellness activities, day of the week, time of day, body state, and togetherness. While the diagram presents a wide range of information, it is visually confusing and hard to read. With much improved aesthetics and more refined attributes, I transformed this general idea into my visualization in Poster Two, the Combined Wellness Bloom.
Phase One:
Final Poster Set
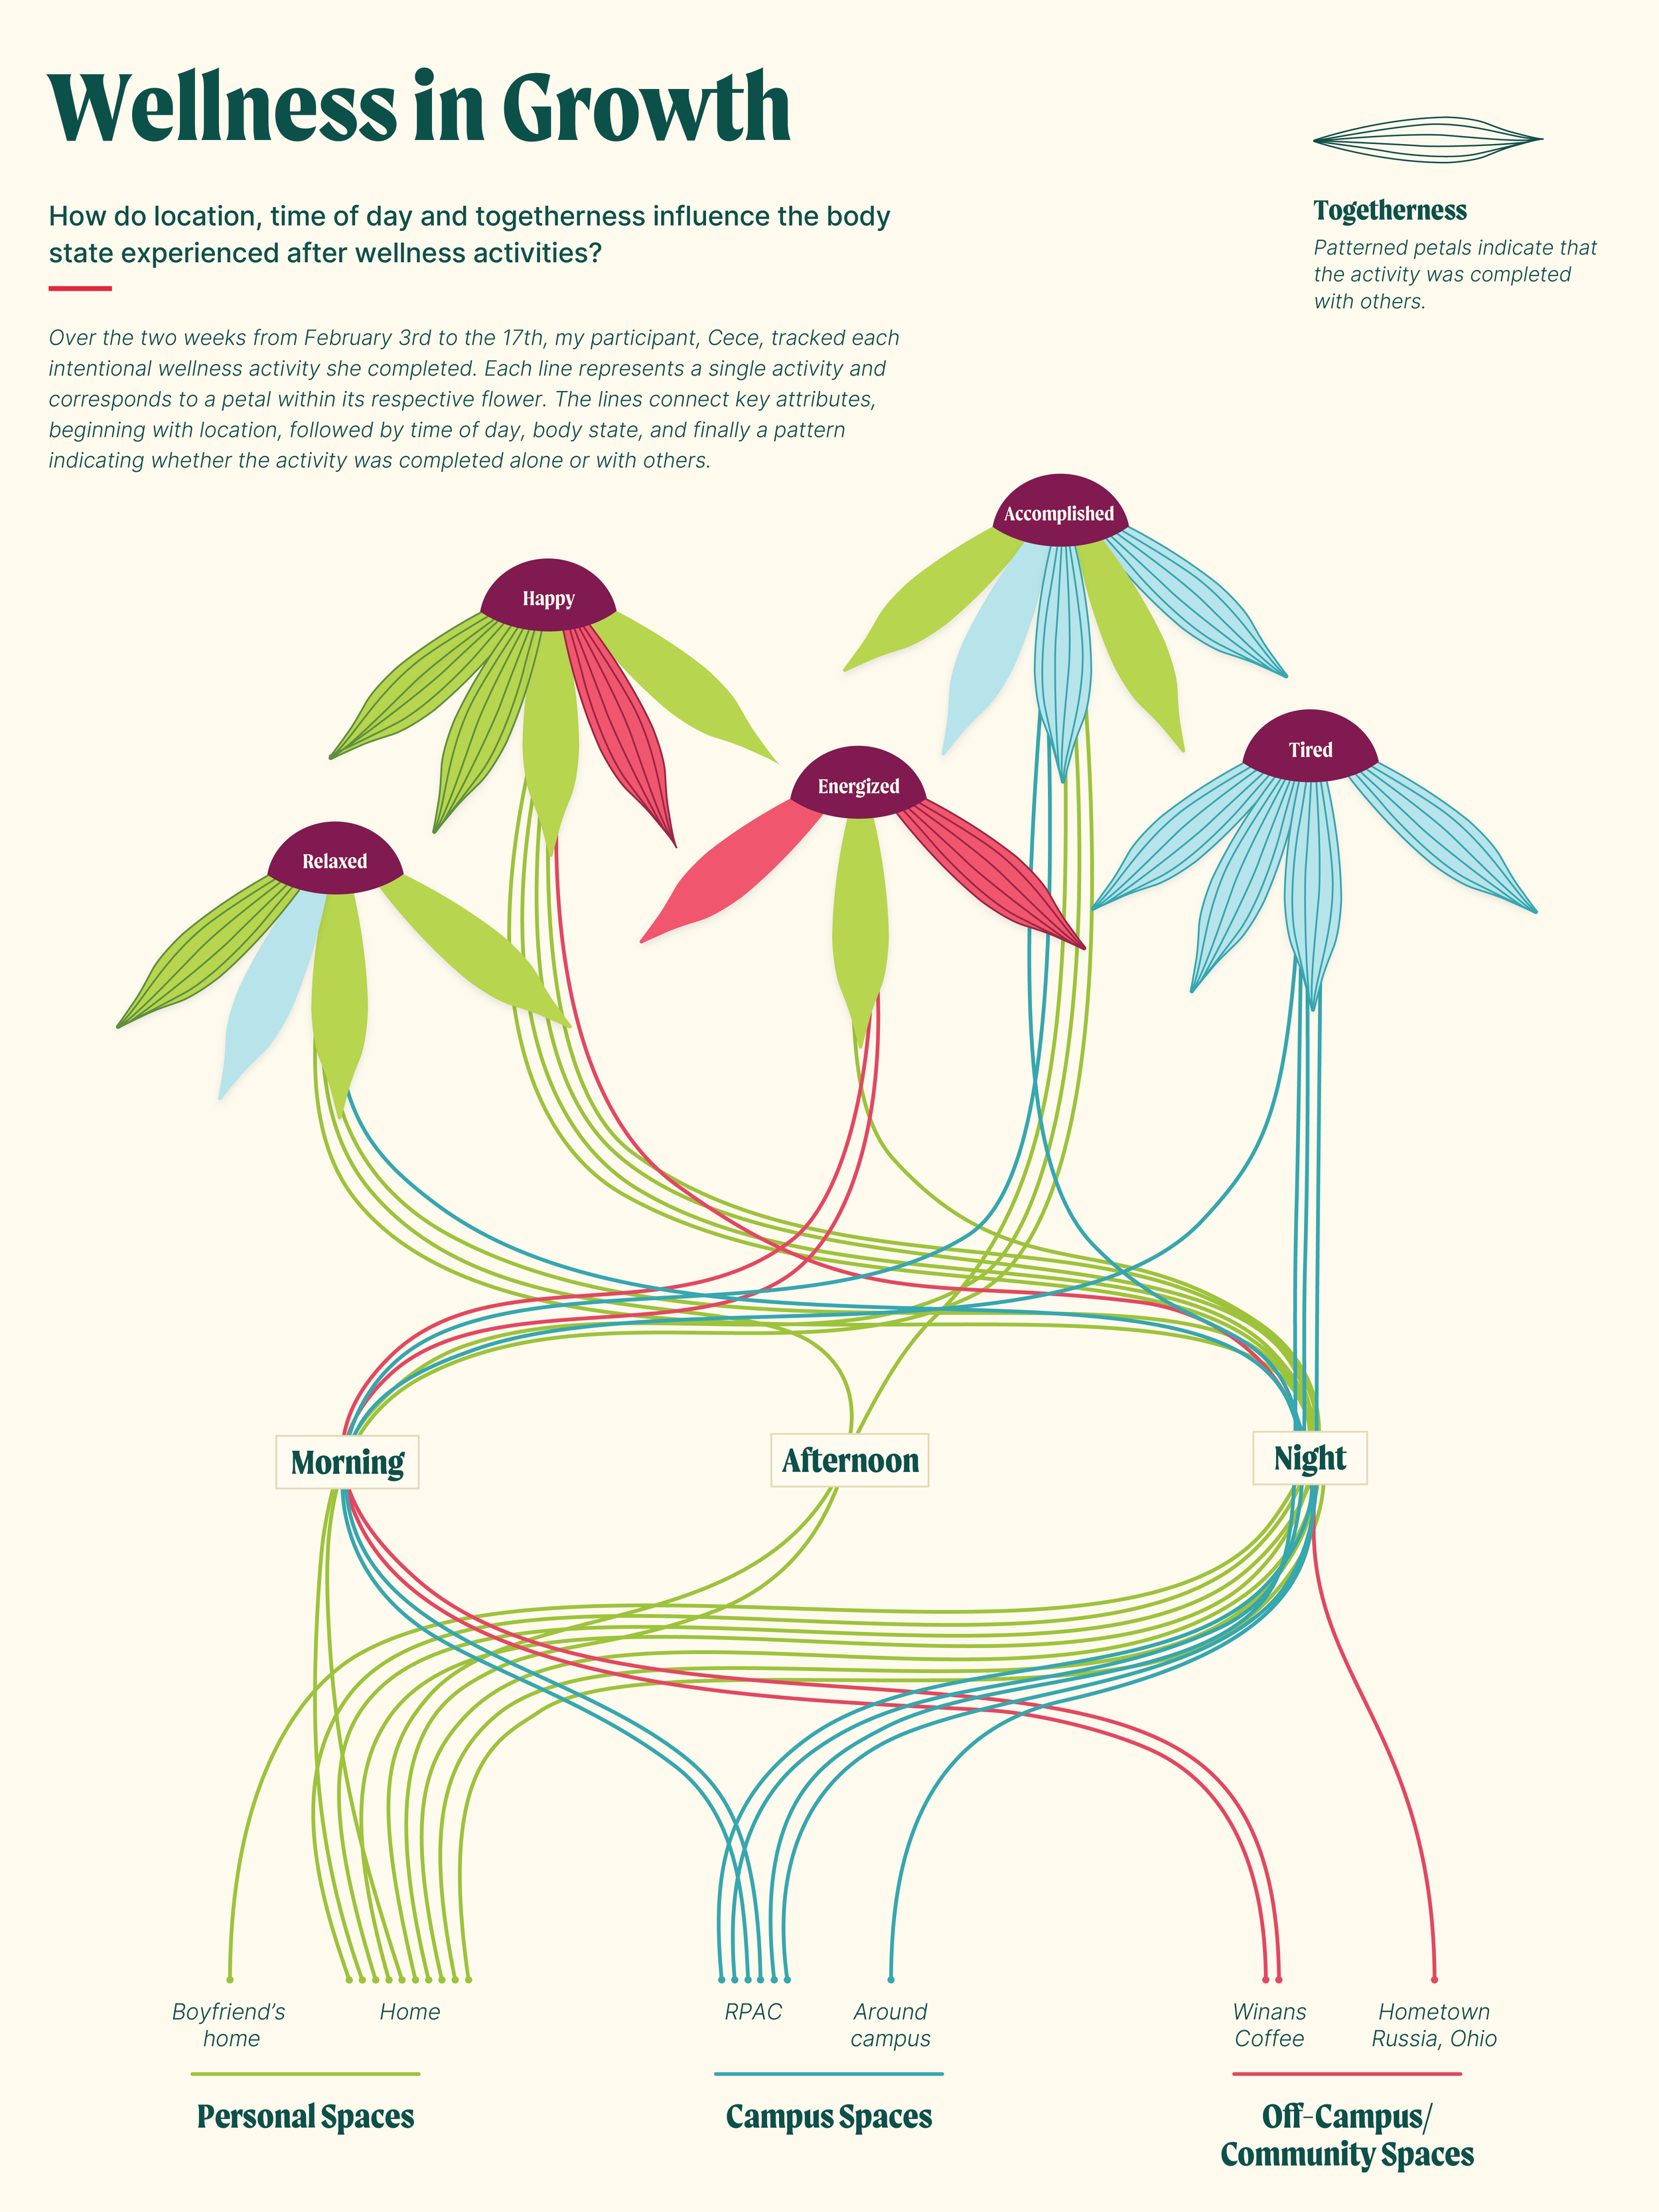
The final posters build upon the initial sketched concepts, translating them into two visually refined compositions that integrate tracked data from both participants. The first poster, Wellness in Growth, focuses exclusively on Cece’s data, examining how the context of her wellness activities relates to how she most commonly feels after engaging in these experiences. The second poster, Combined Wellness Bloom, presents a shared wellness visualization, comparing how two individuals experience wellness to identify patterns in routine, frequency, and behavior.
Phase Two:
Sketches and Ideation
I knew I wanted the physical interpretation of my participant, Cece’s, data to feel interactive rather than purely observational. Since the data focused on wellness and intentional living, I developed a concept for a sun catcher that, through interactive participation, gradually fills with translucent, colored pieces, each representing a moment of intentional wellness from Cece’s daily experiences.
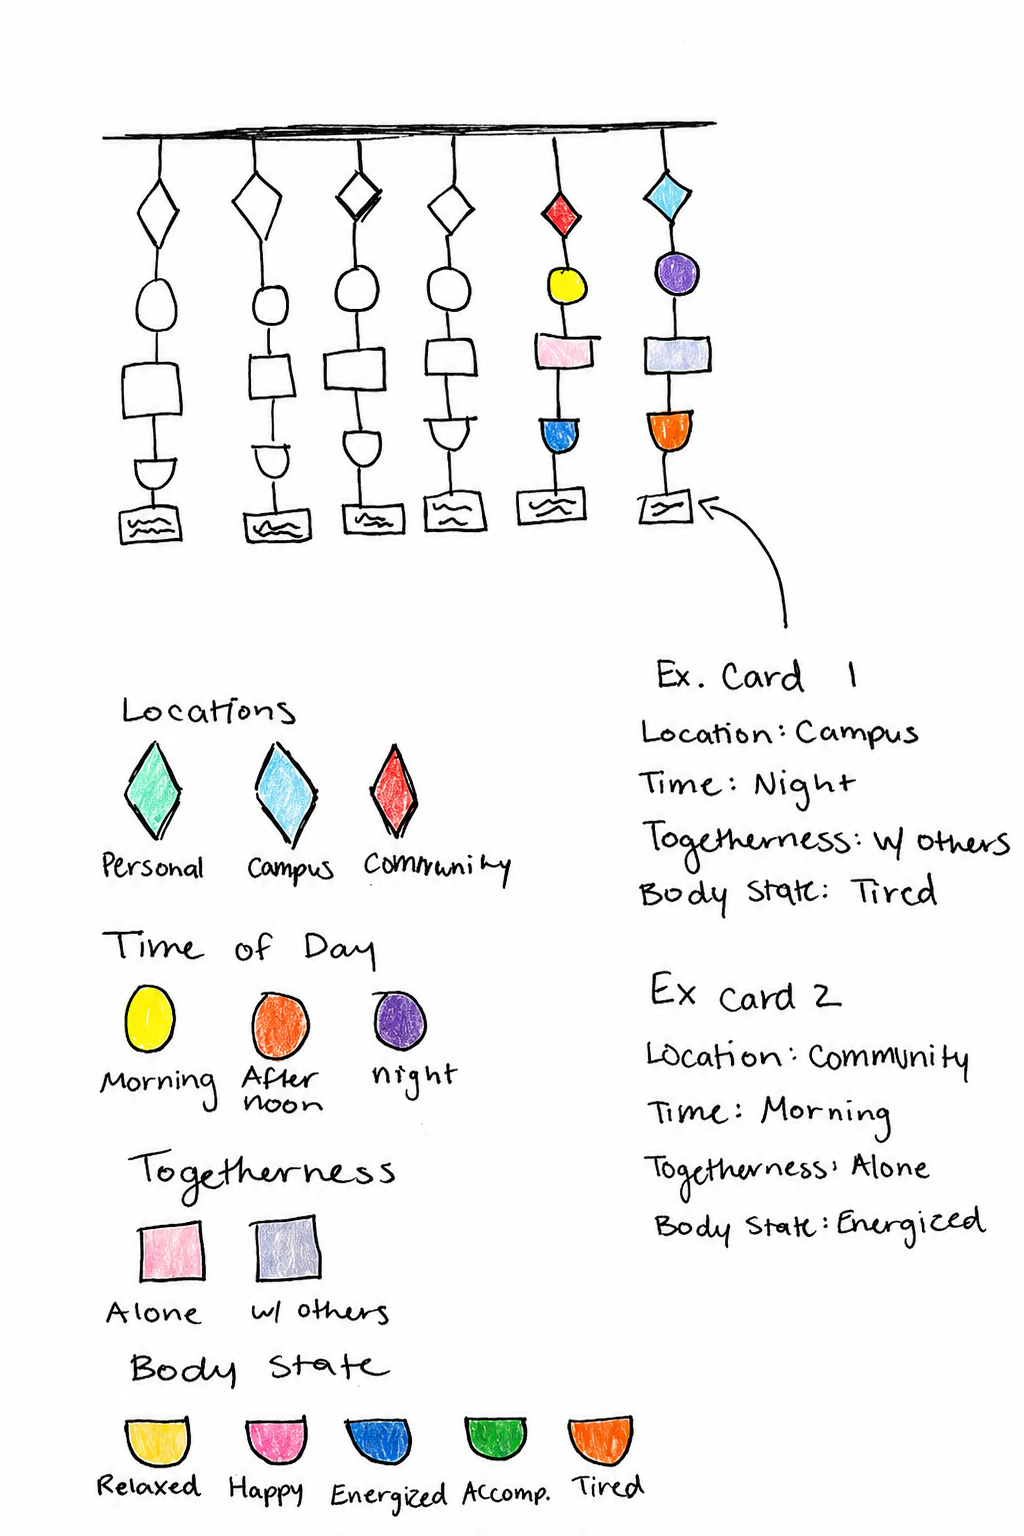
Concept 1: Conceptual Shapes
This was my initial concept for an interactive sun catcher, where different wellness attributes would be represented through encoded shapes. The interaction participant would match and attach corresponding pieces to the sun catcher, gradually building up a visual record of Cece’s activities. While I liked that the system gave each attribute a clear, structured form to connect with, I felt that the use of rigid shapes created a bit of a disconnect from the more fluid nature of the wellness experience I was trying to represent.
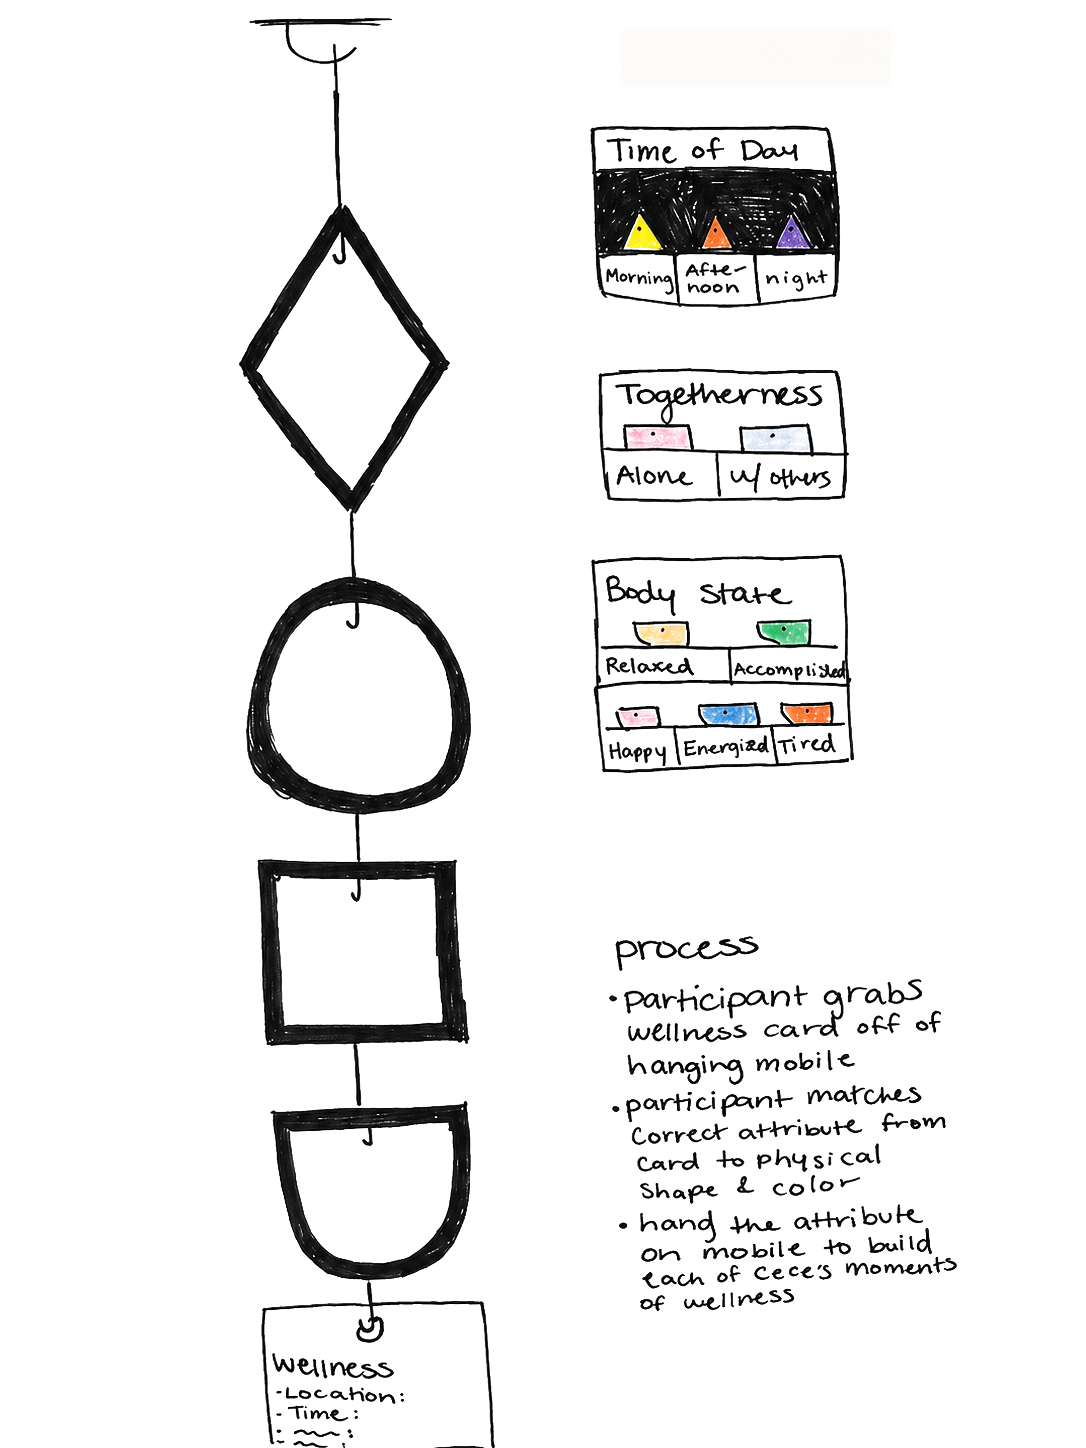
Concept 2: Wellness Inspired Shapes
My second concept for the interactive sun catcher maintains a similar process and overall experience, but with a more intentional structure. Instead of using varied, abstract shapes to house each component, all hanging pieces are uniform circles that are then filled with wellness-inspired translucent elements, like flowers and leaves. Interaction participants then assemble the components in the correct sequence, allowing meaning to emerge through both order and placement.
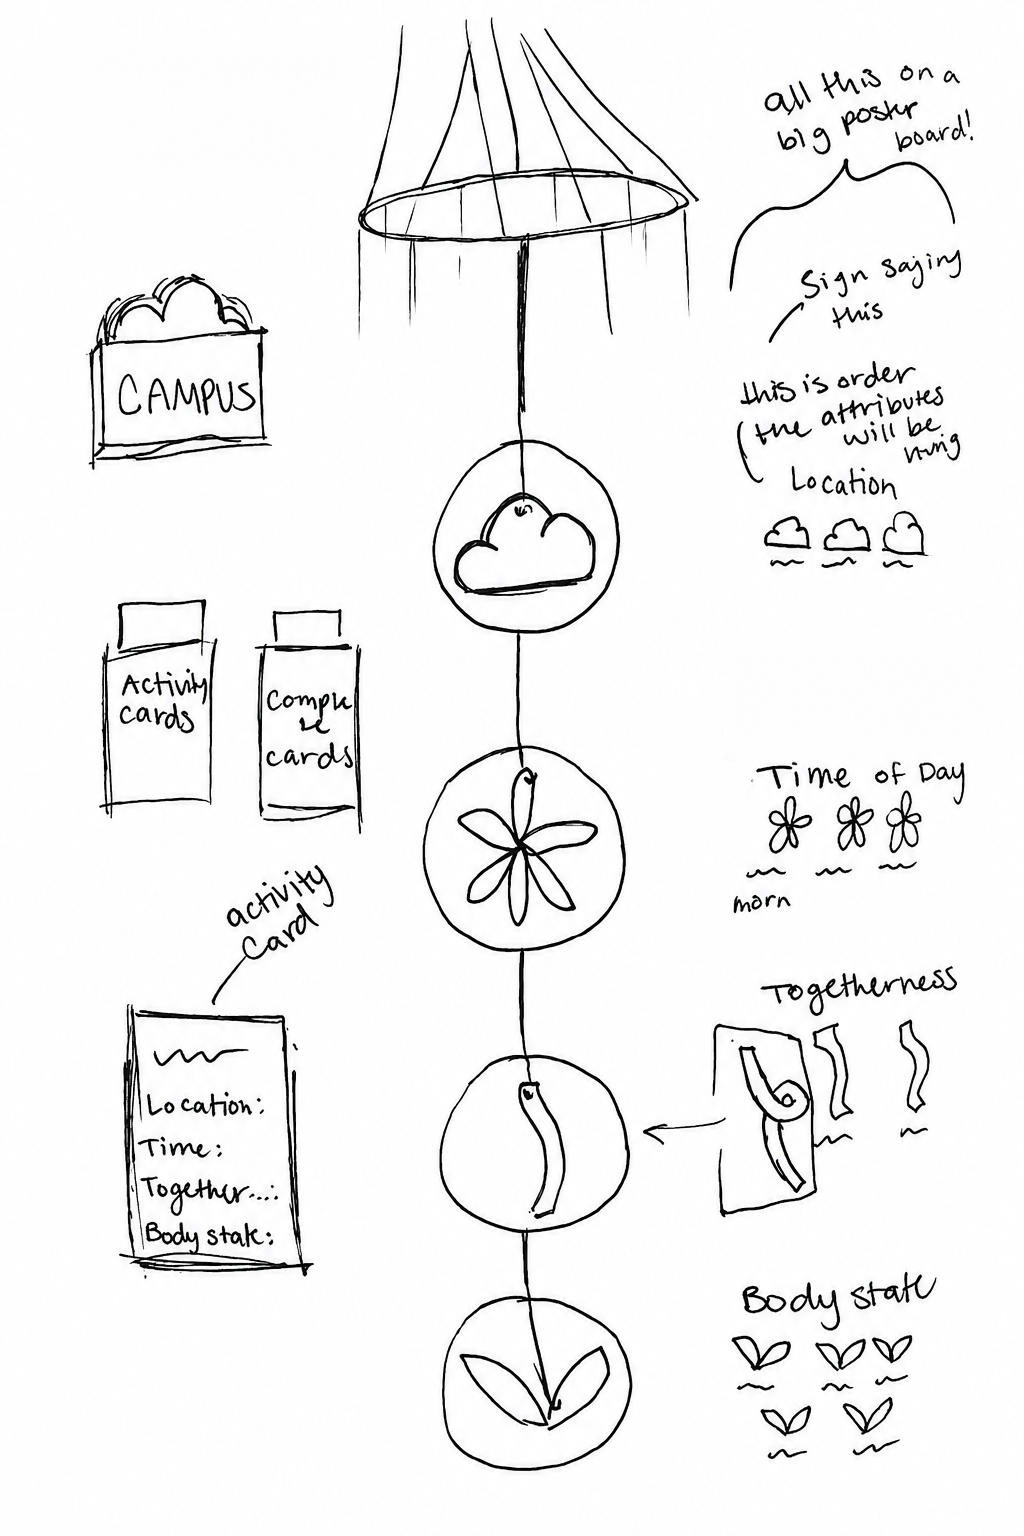
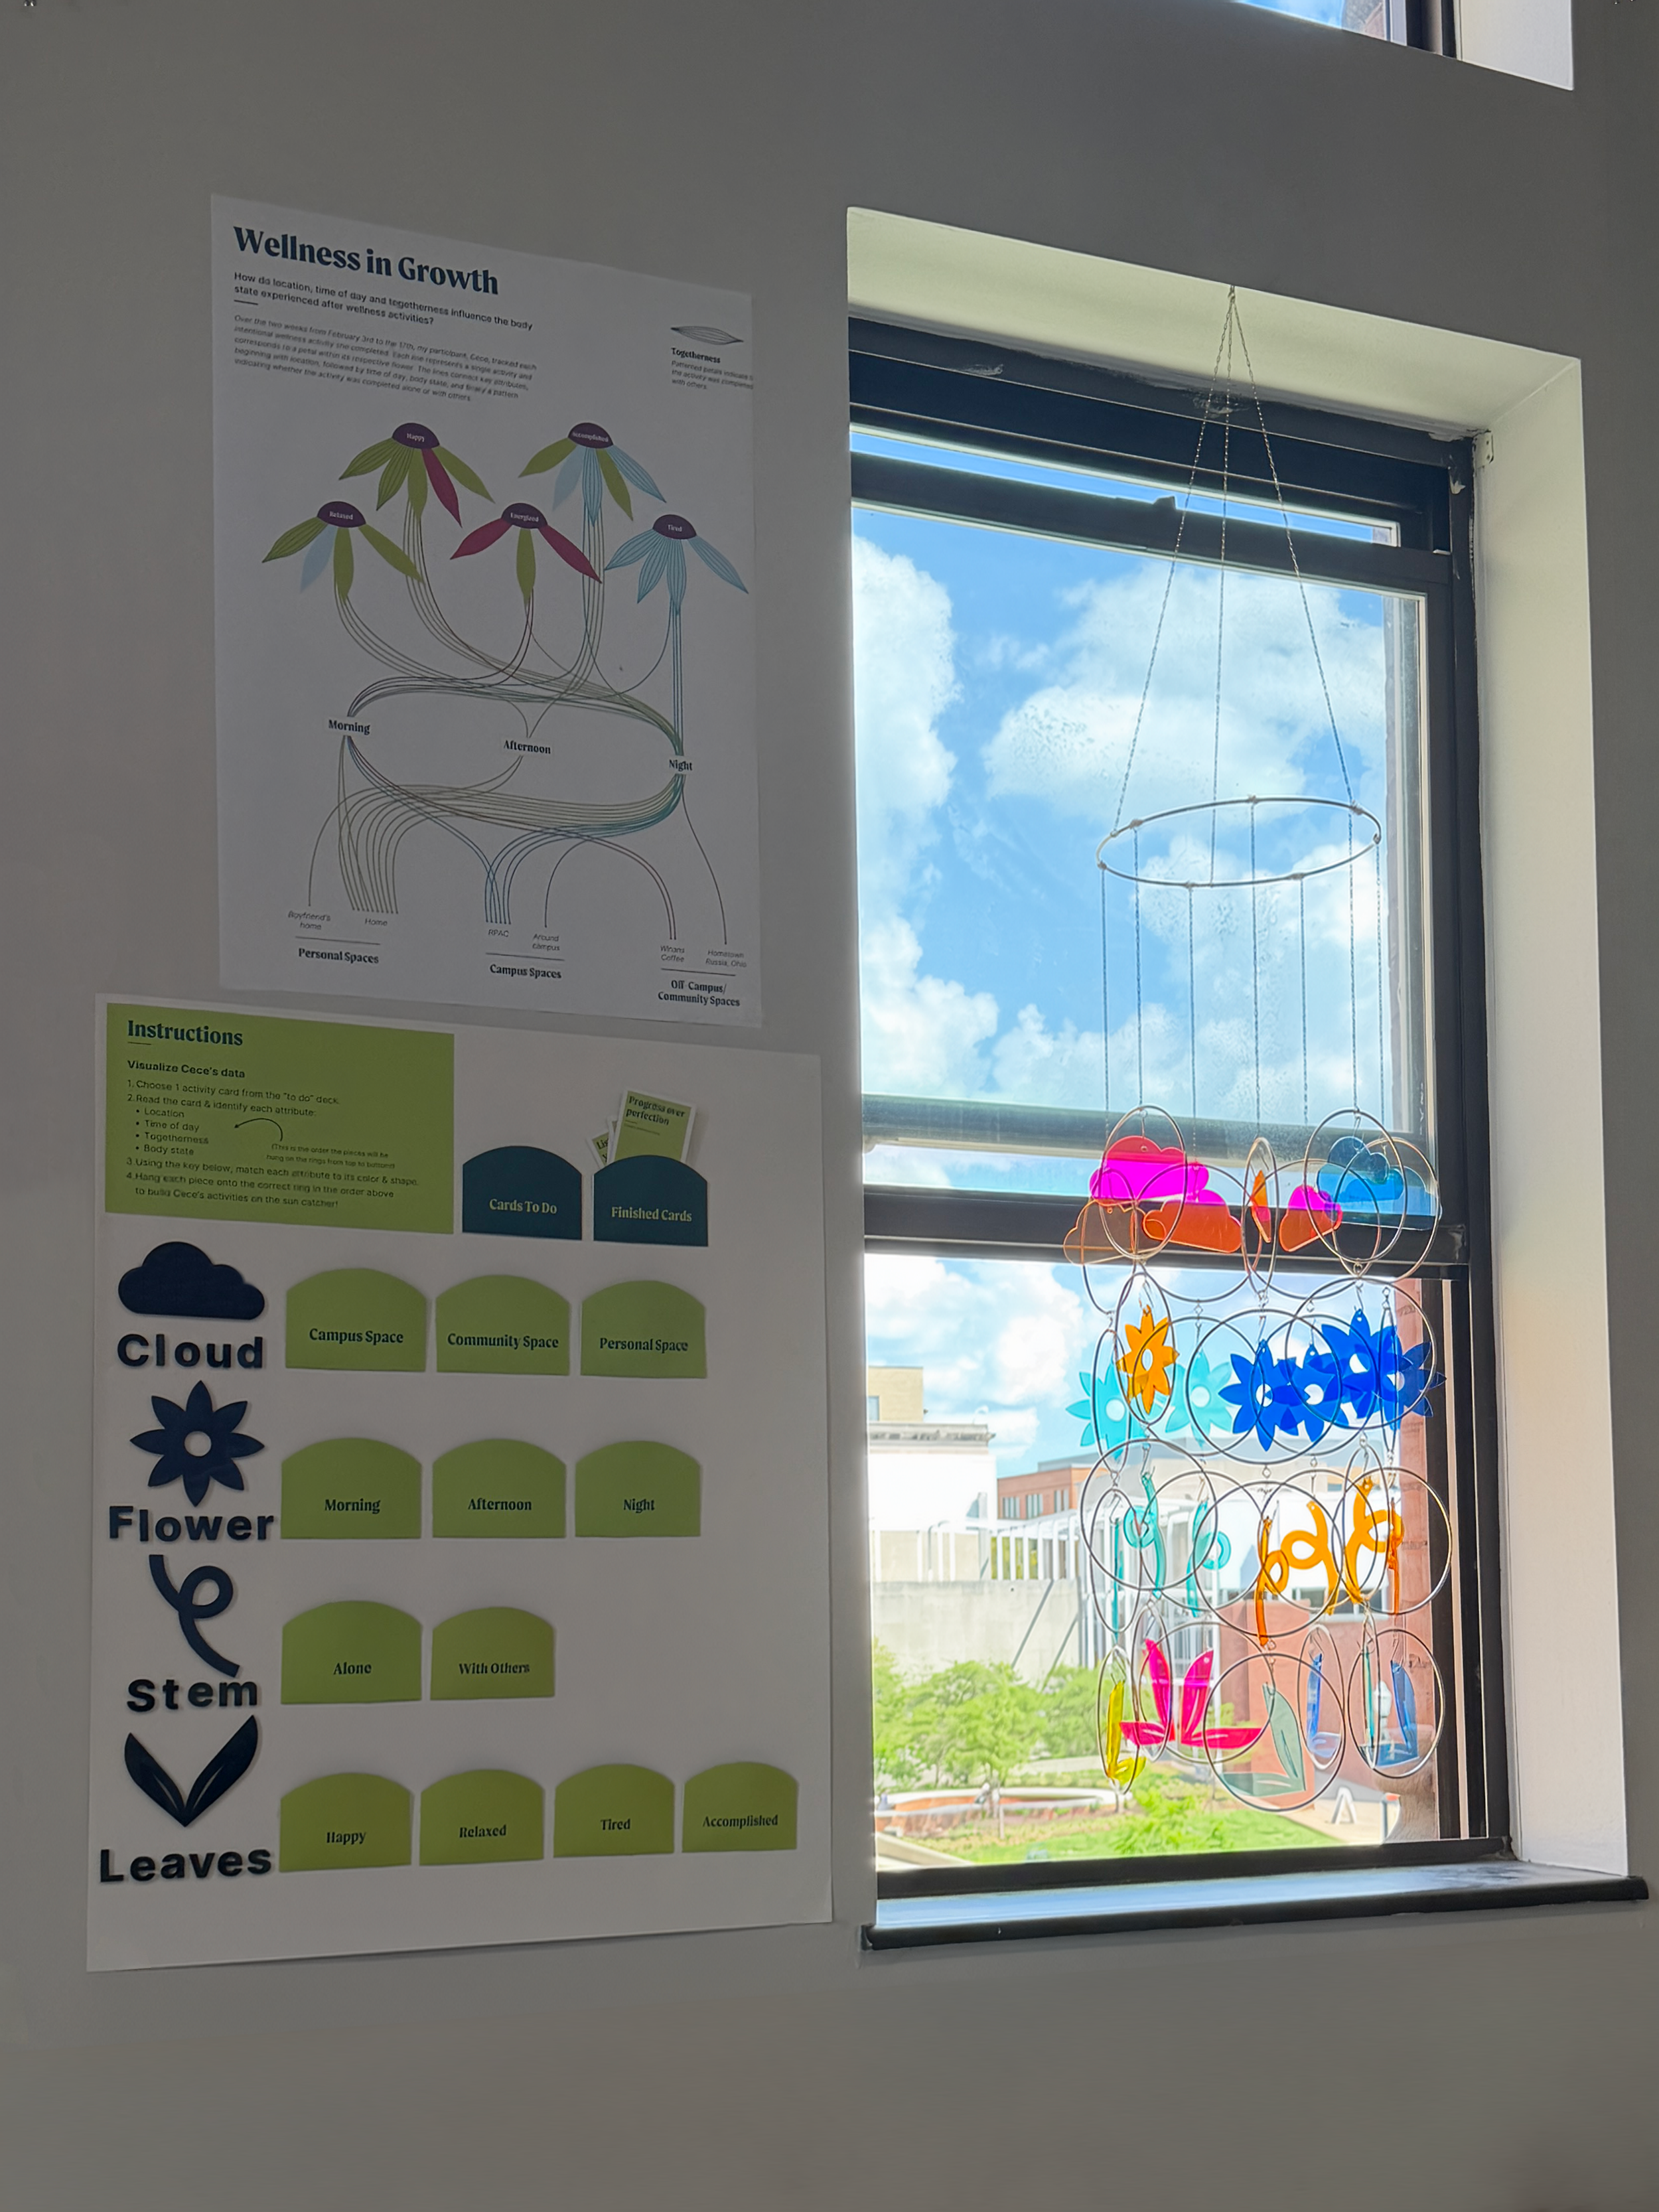
Since interaction participants are responsible for assembling the sun catcher in the correct sequence, I had to carefully consider how to communicate the workflow clearly and intuitively. I explored different instructional strategies to support this, including a wall piece displayed alongside the sun catcher, as well as clearly printed, step-by-step directions.
Considerations
Building the Experience
Although the interactive piece is grounded in wellness data collected from Cece, I also wanted to give participants the option to input their own data and create a personalized sun catcher.
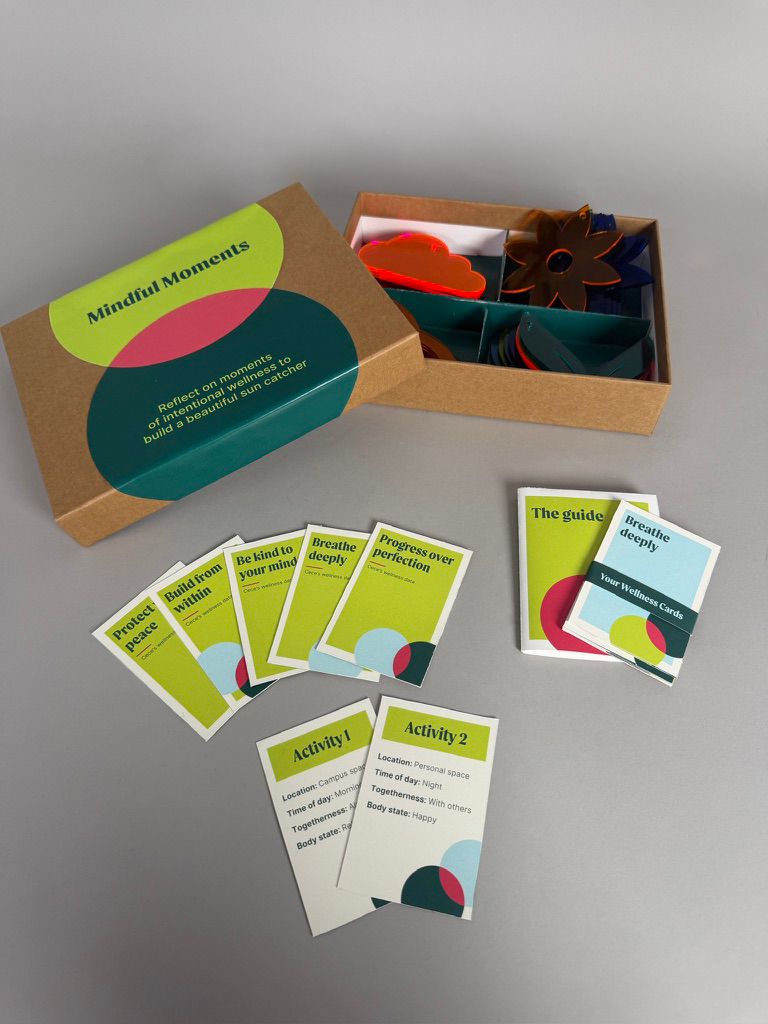
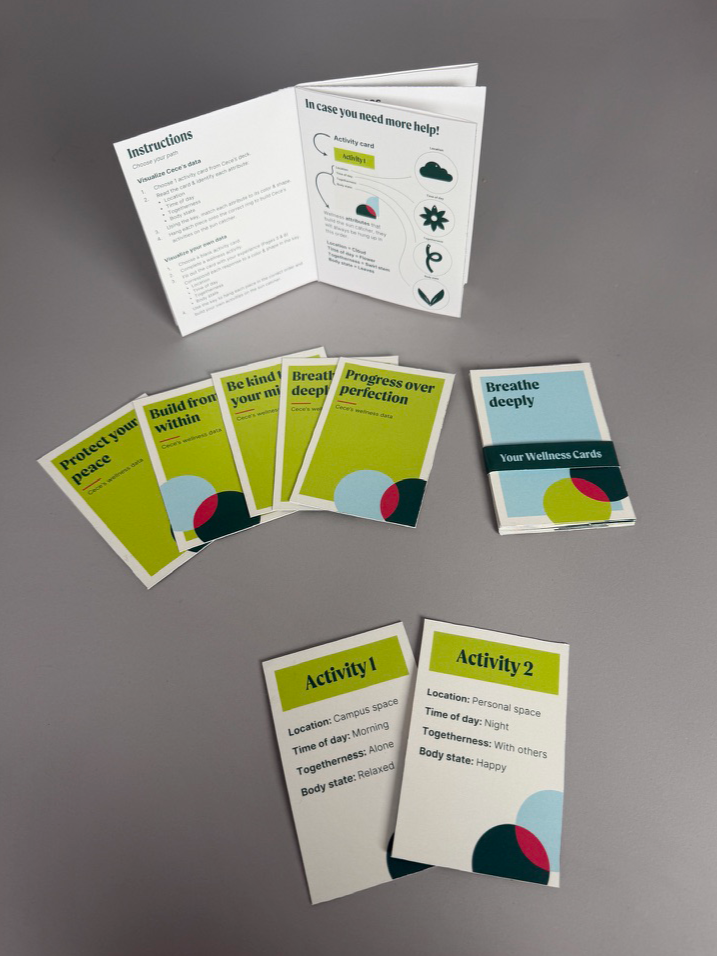
I developed a branded, card-based system that allows participants to either reconstruct Cece’s sun catcher or design one based on their own experiences of wellness.
The Activity Cards
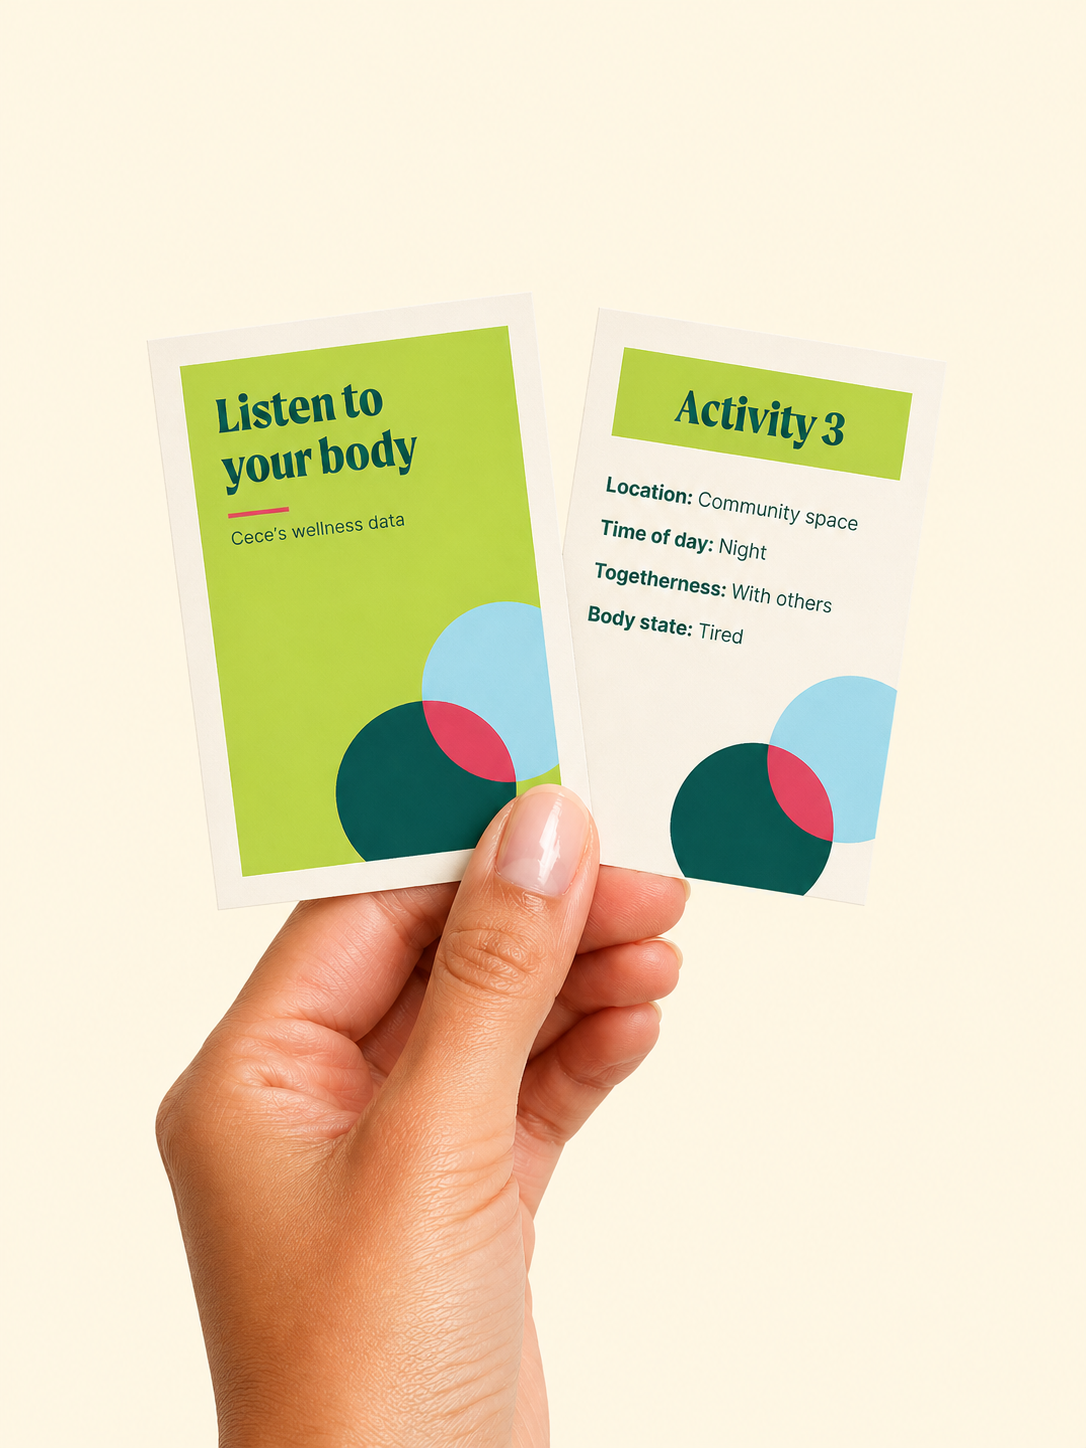
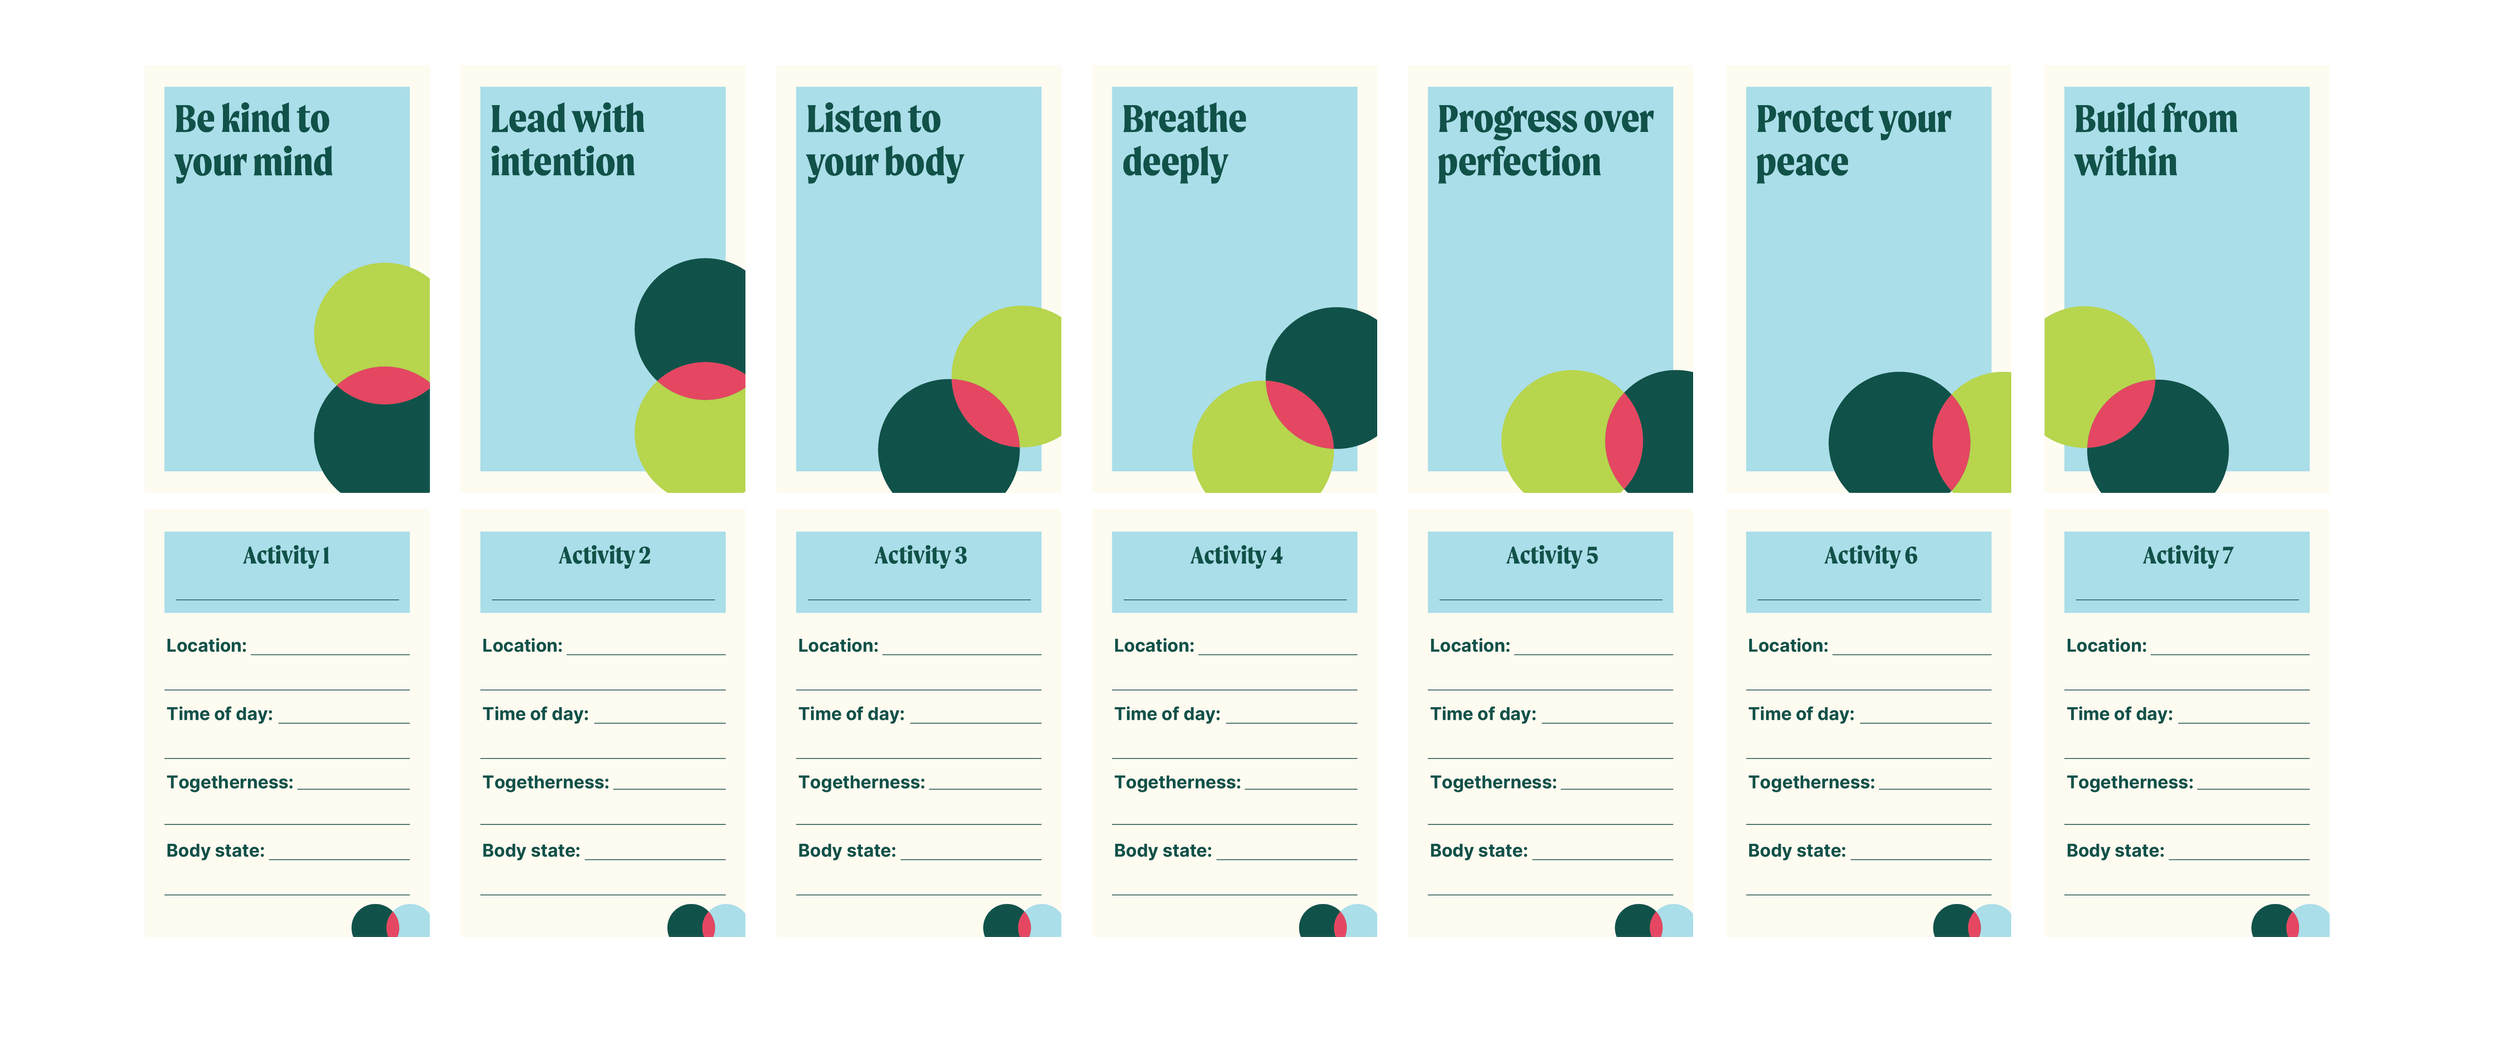
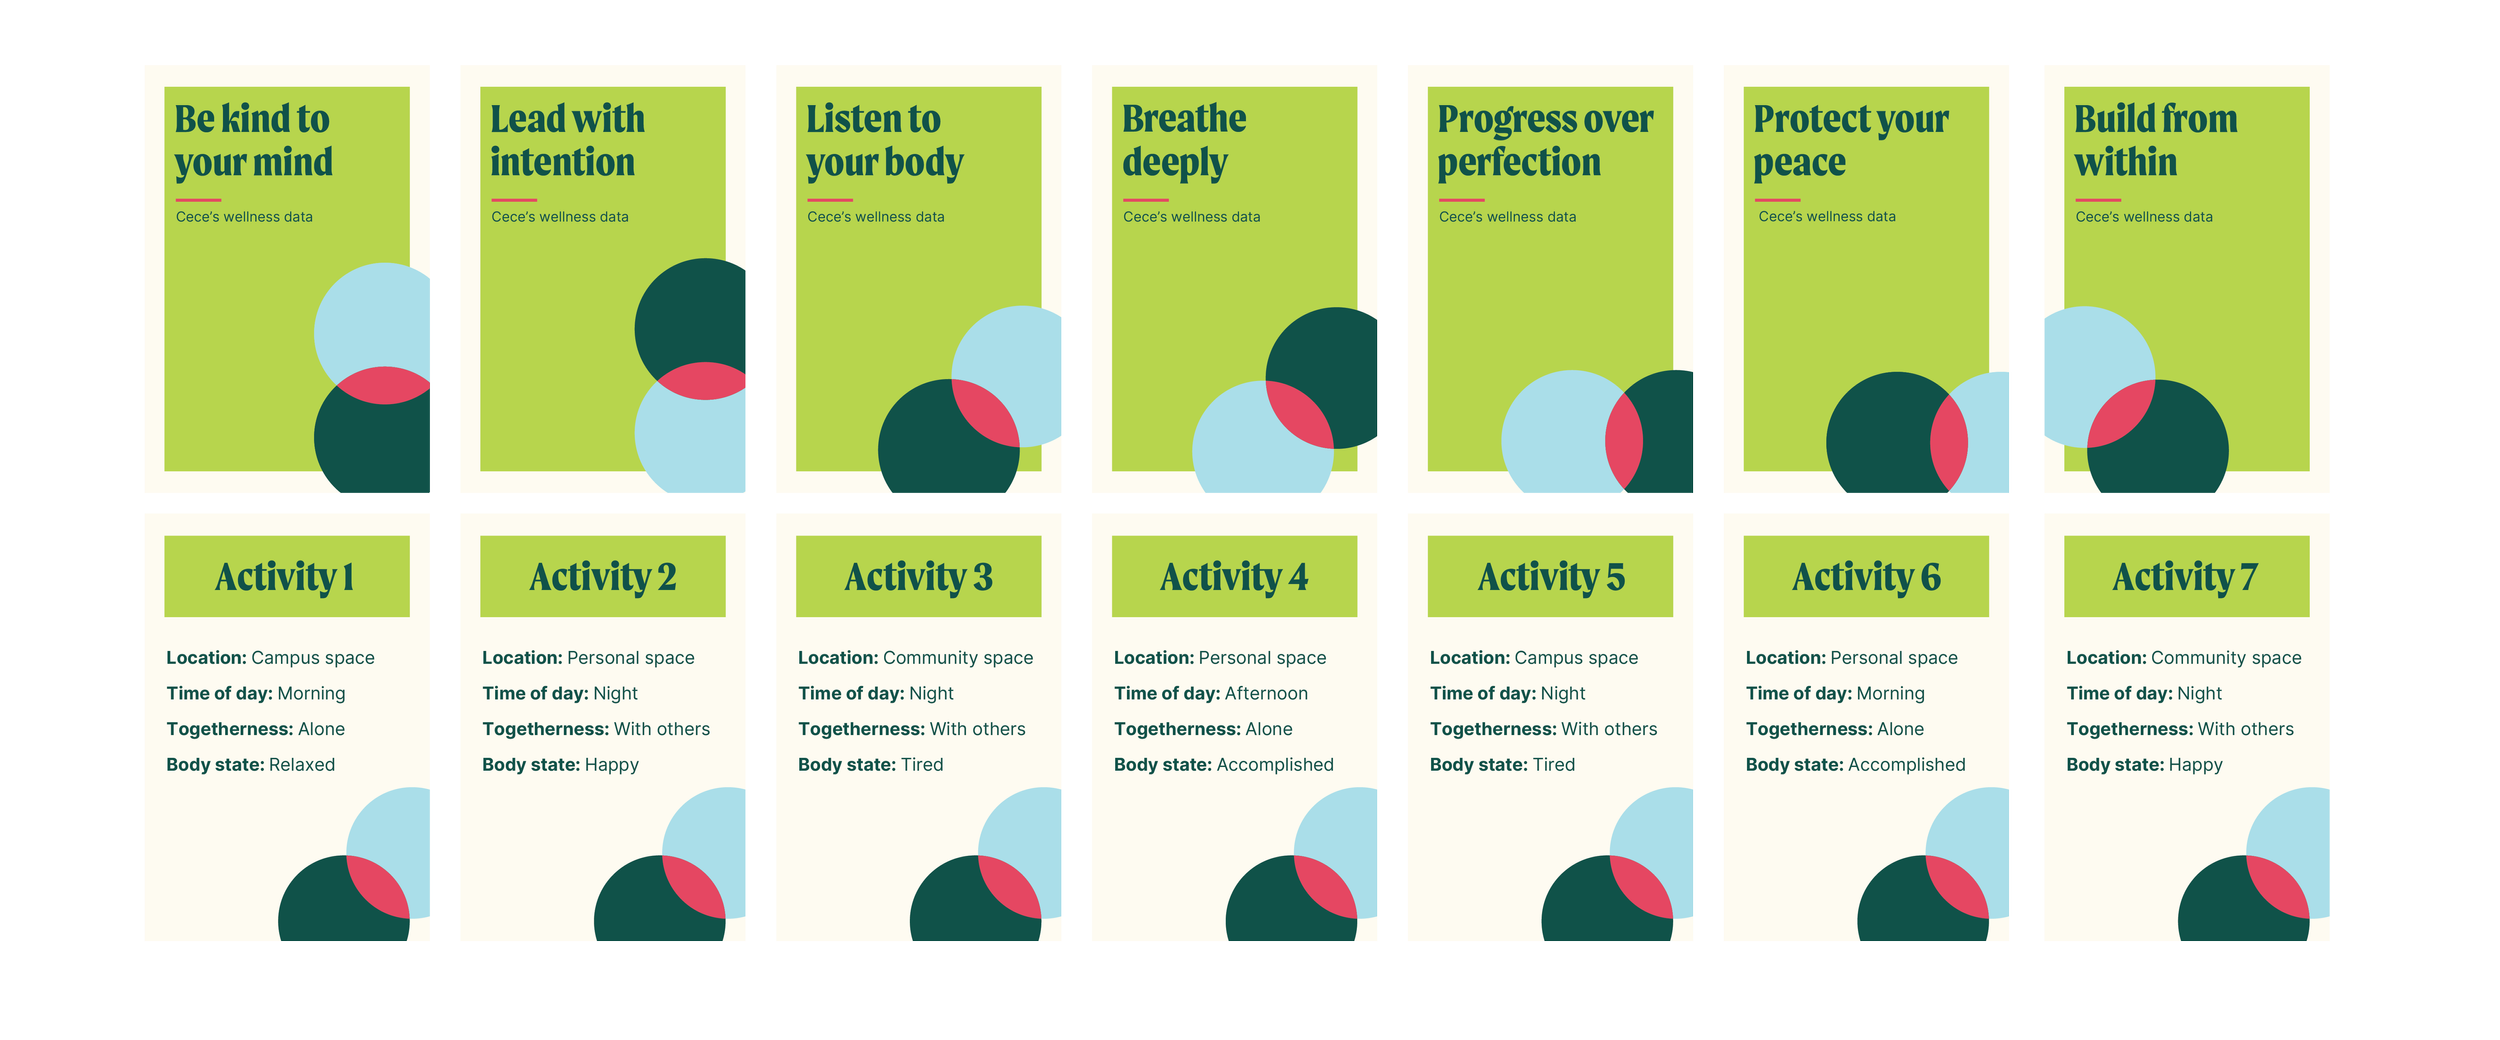
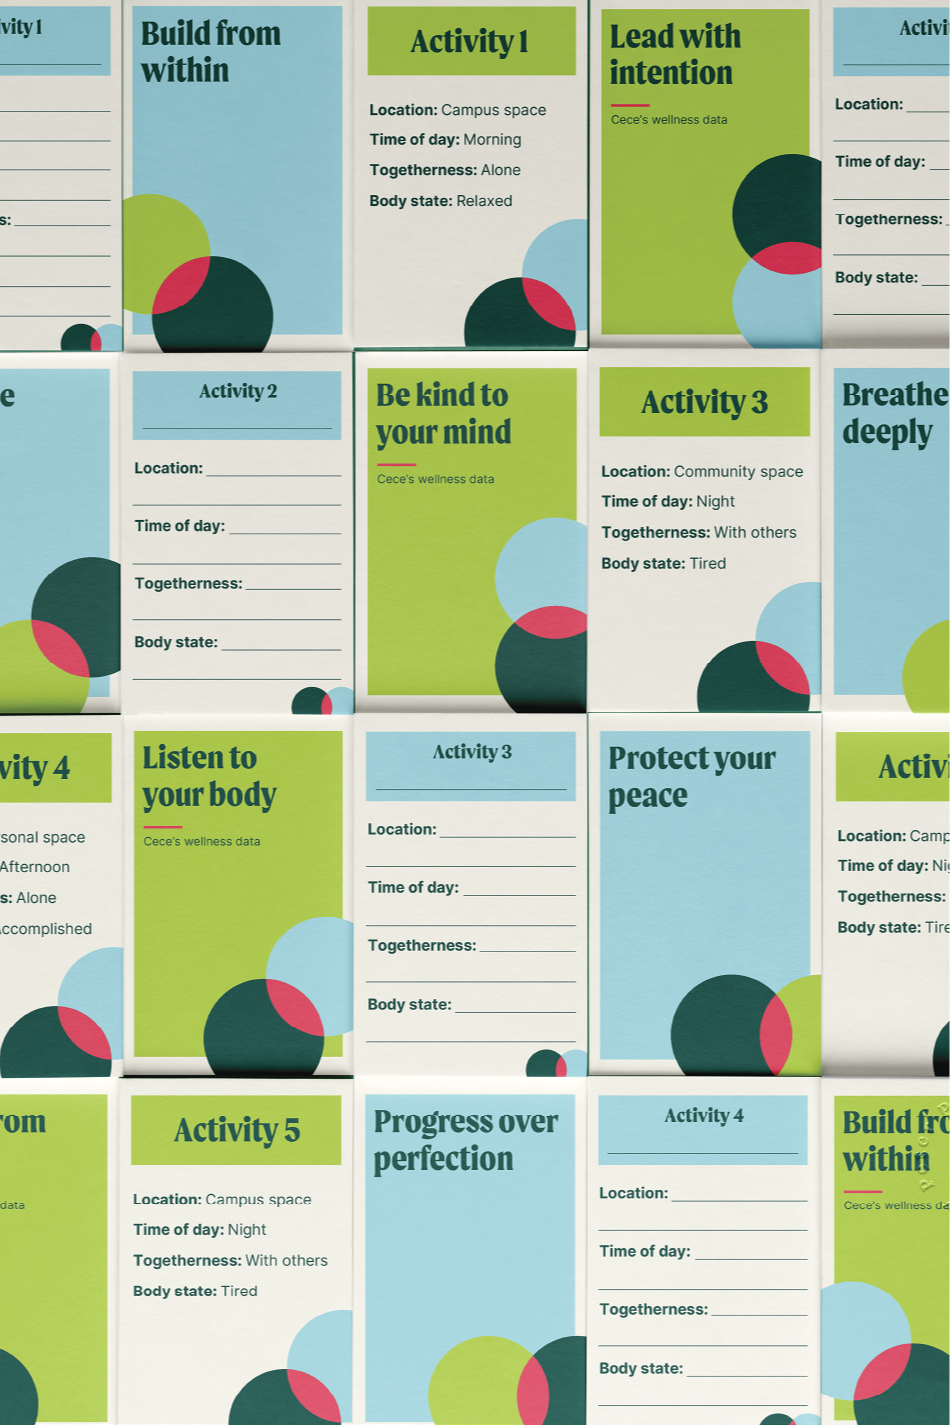
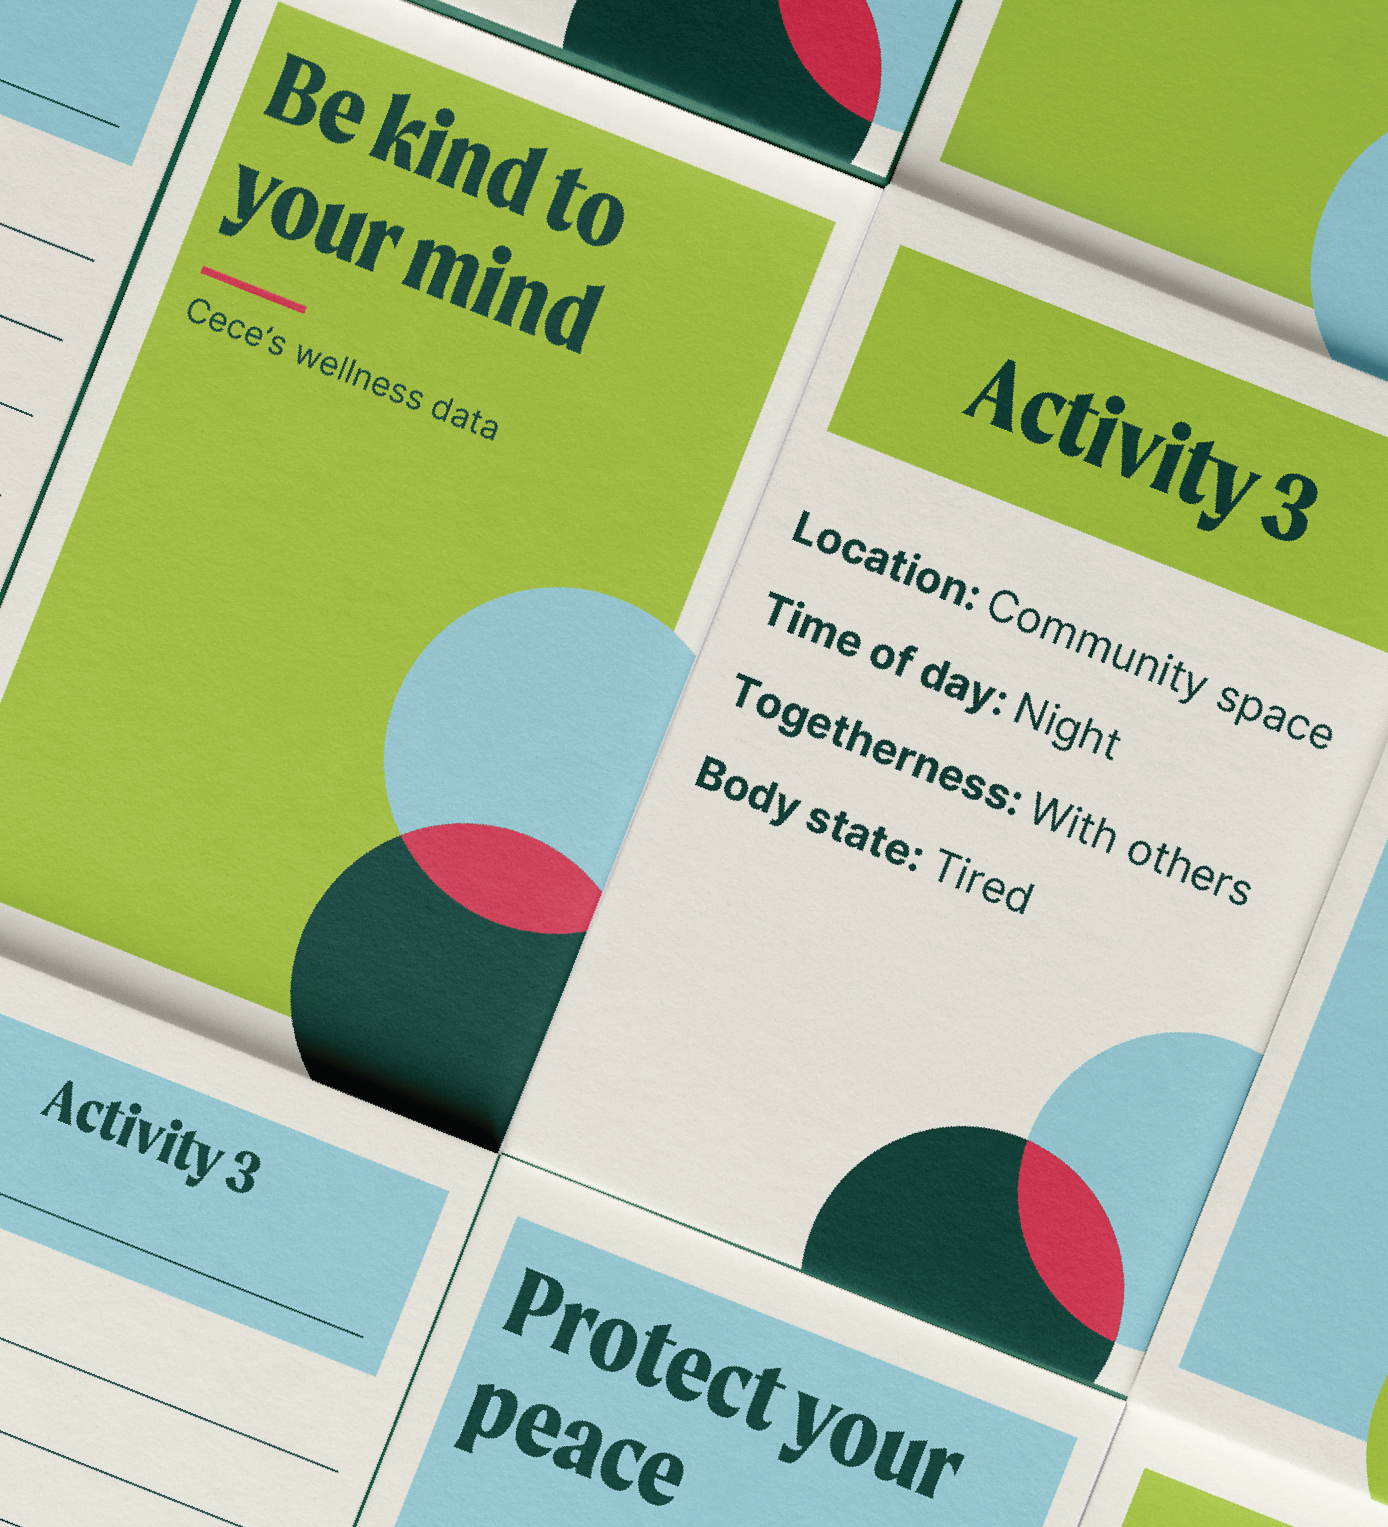
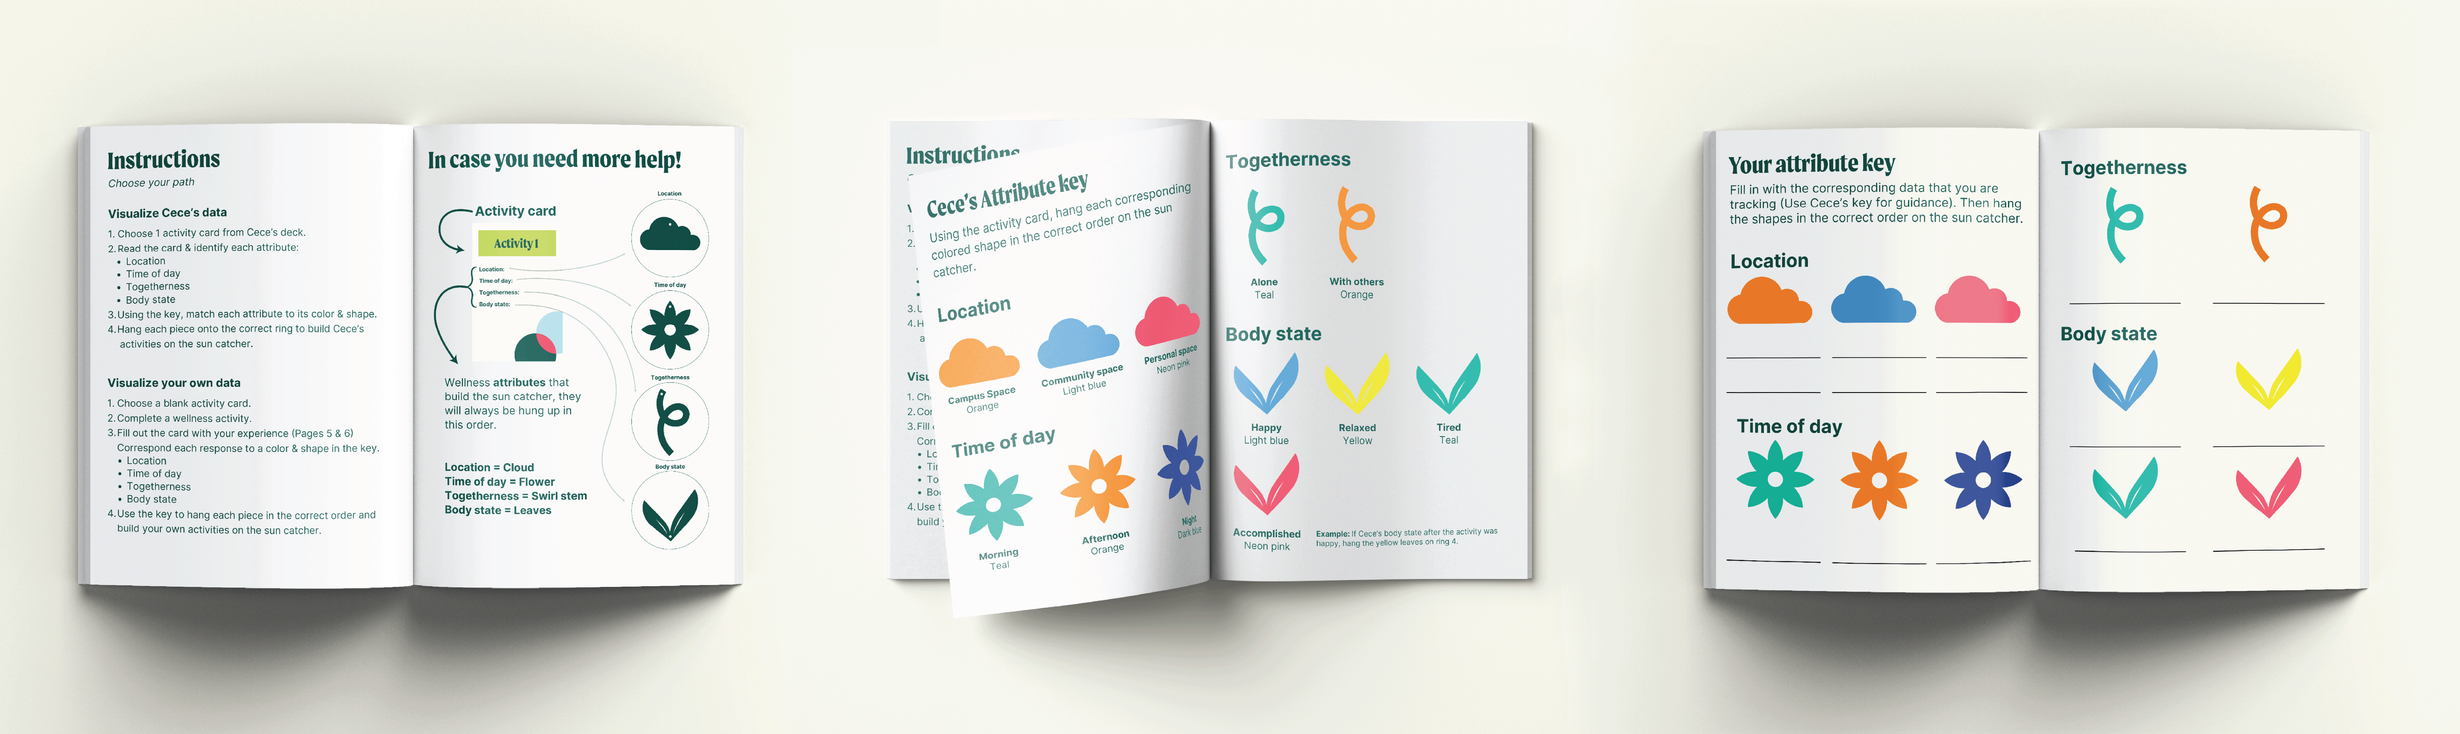
To support the card system and guide participants through the process, I also developed a guidebook. This resource helps participants understand Cece’s wellness attributes while also providing space for them to define and incorporate their own if they choose to create a personalized sun catcher.
The Activity Guide

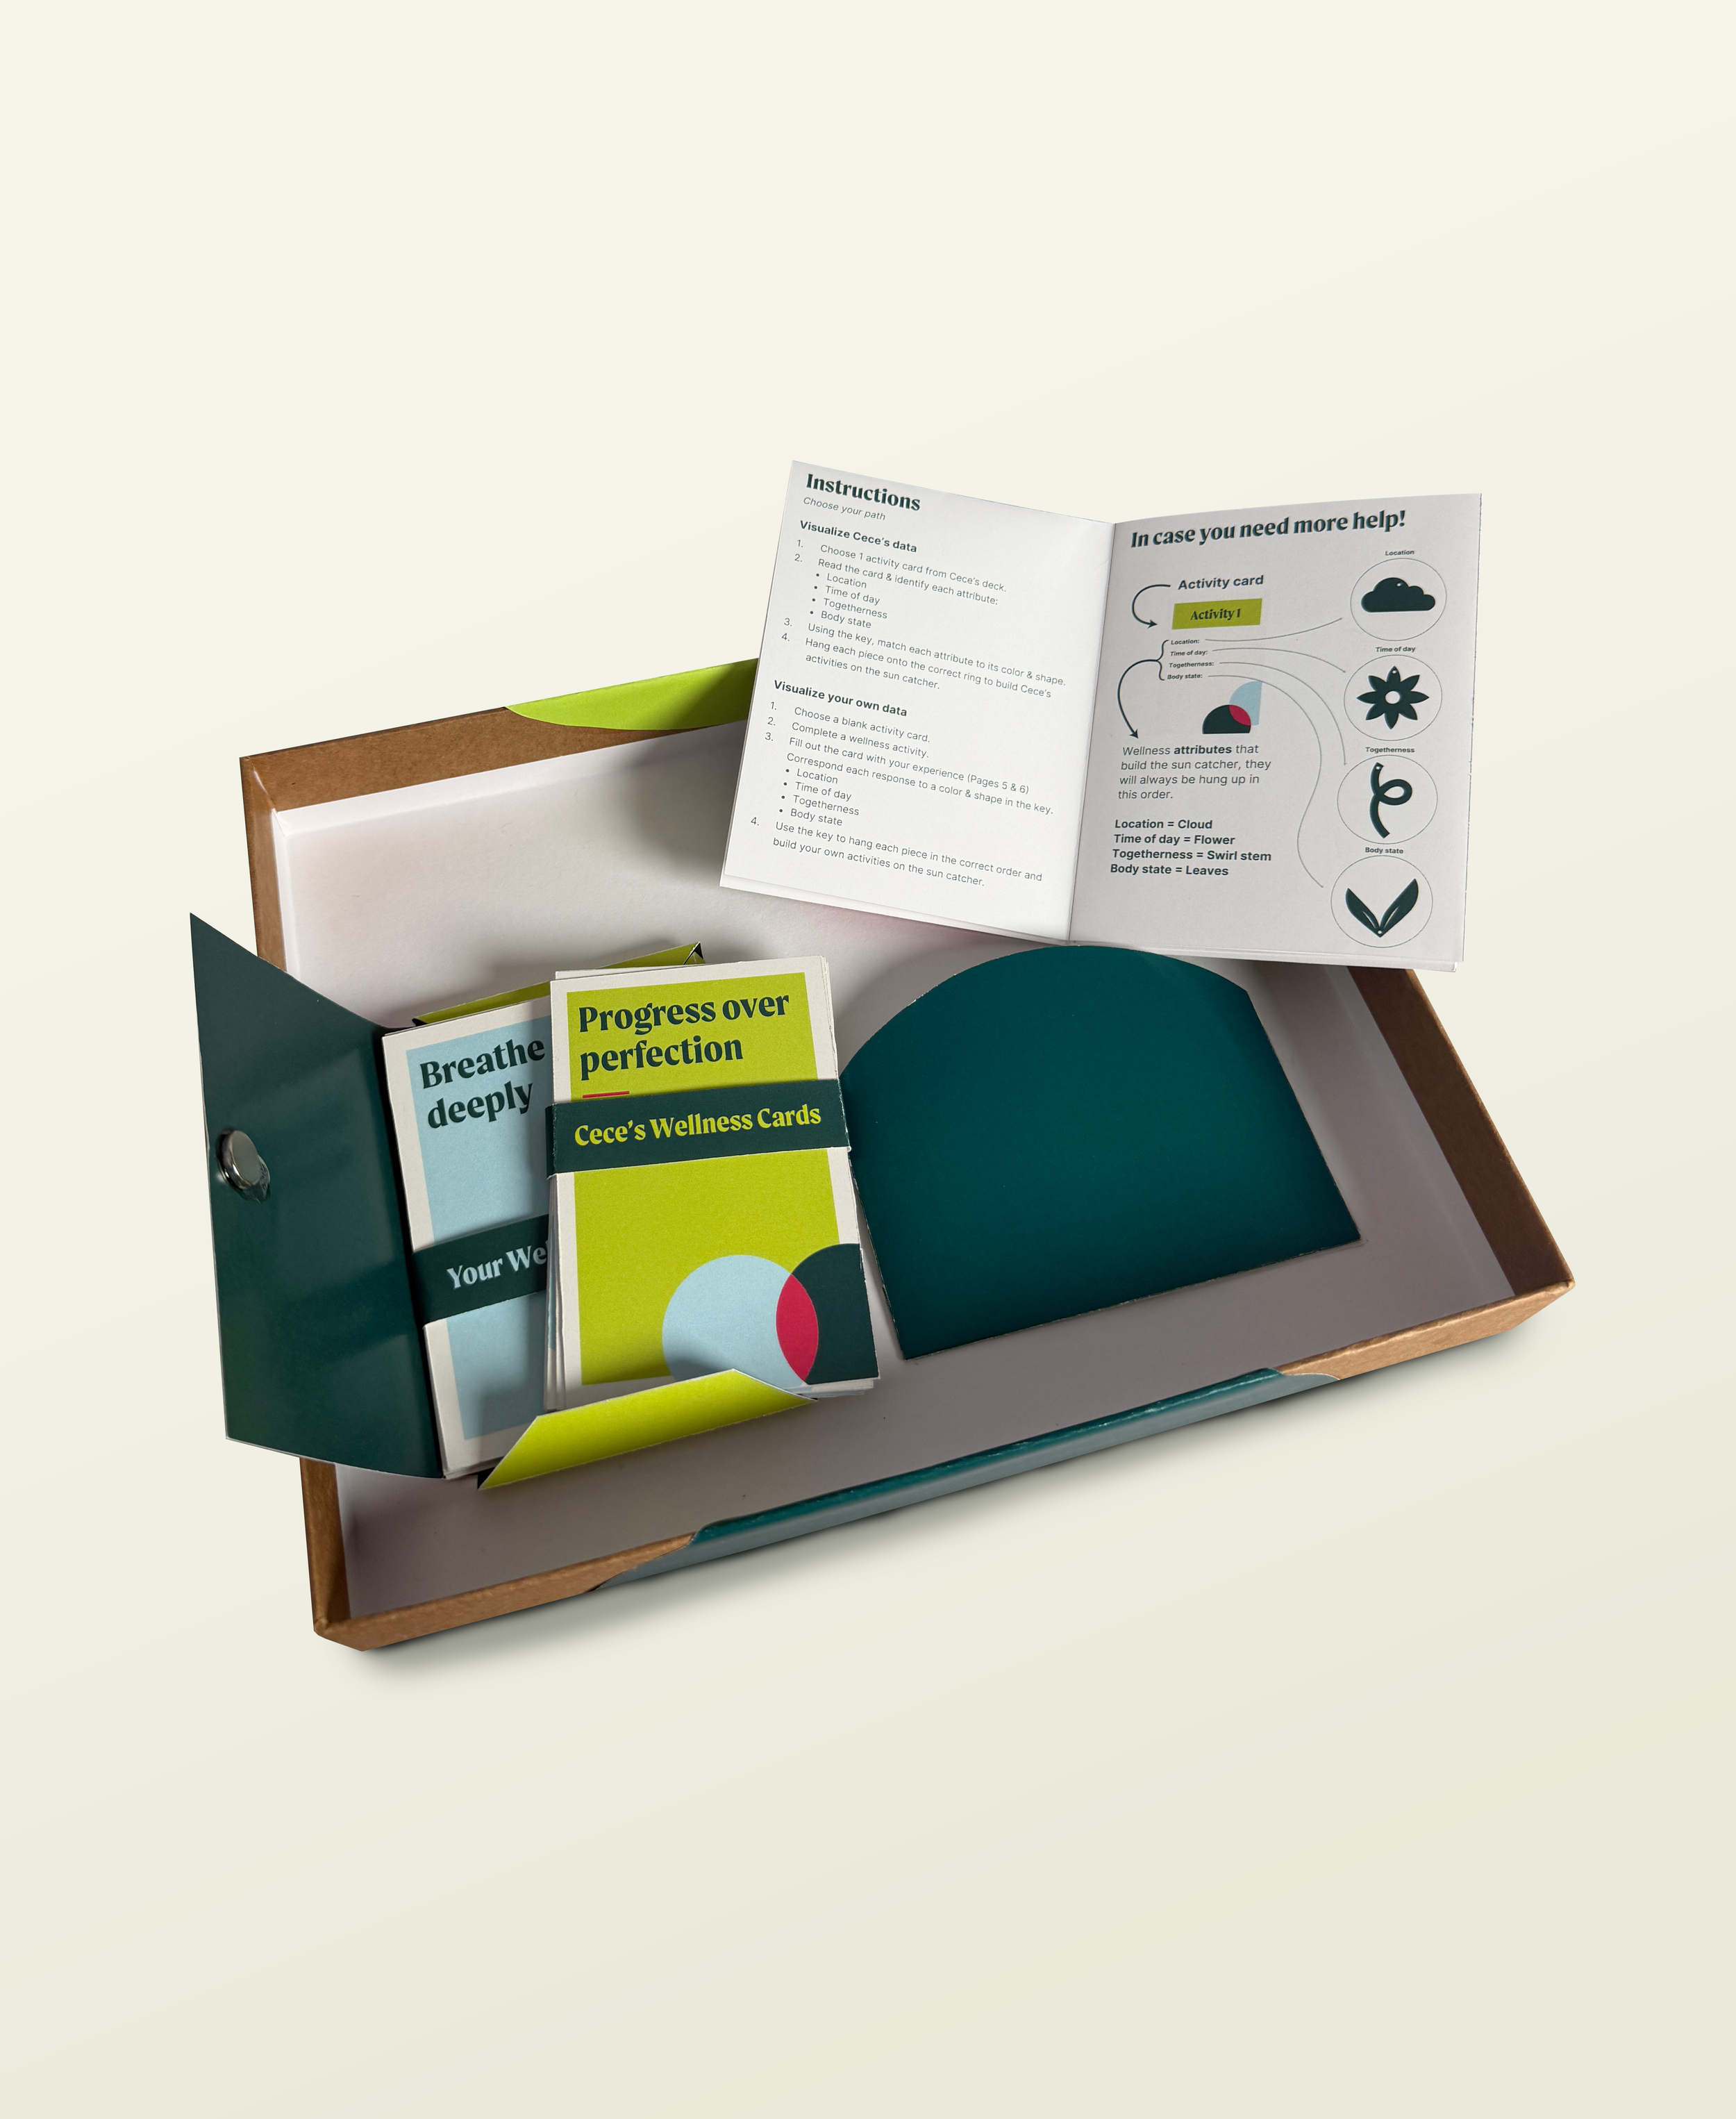
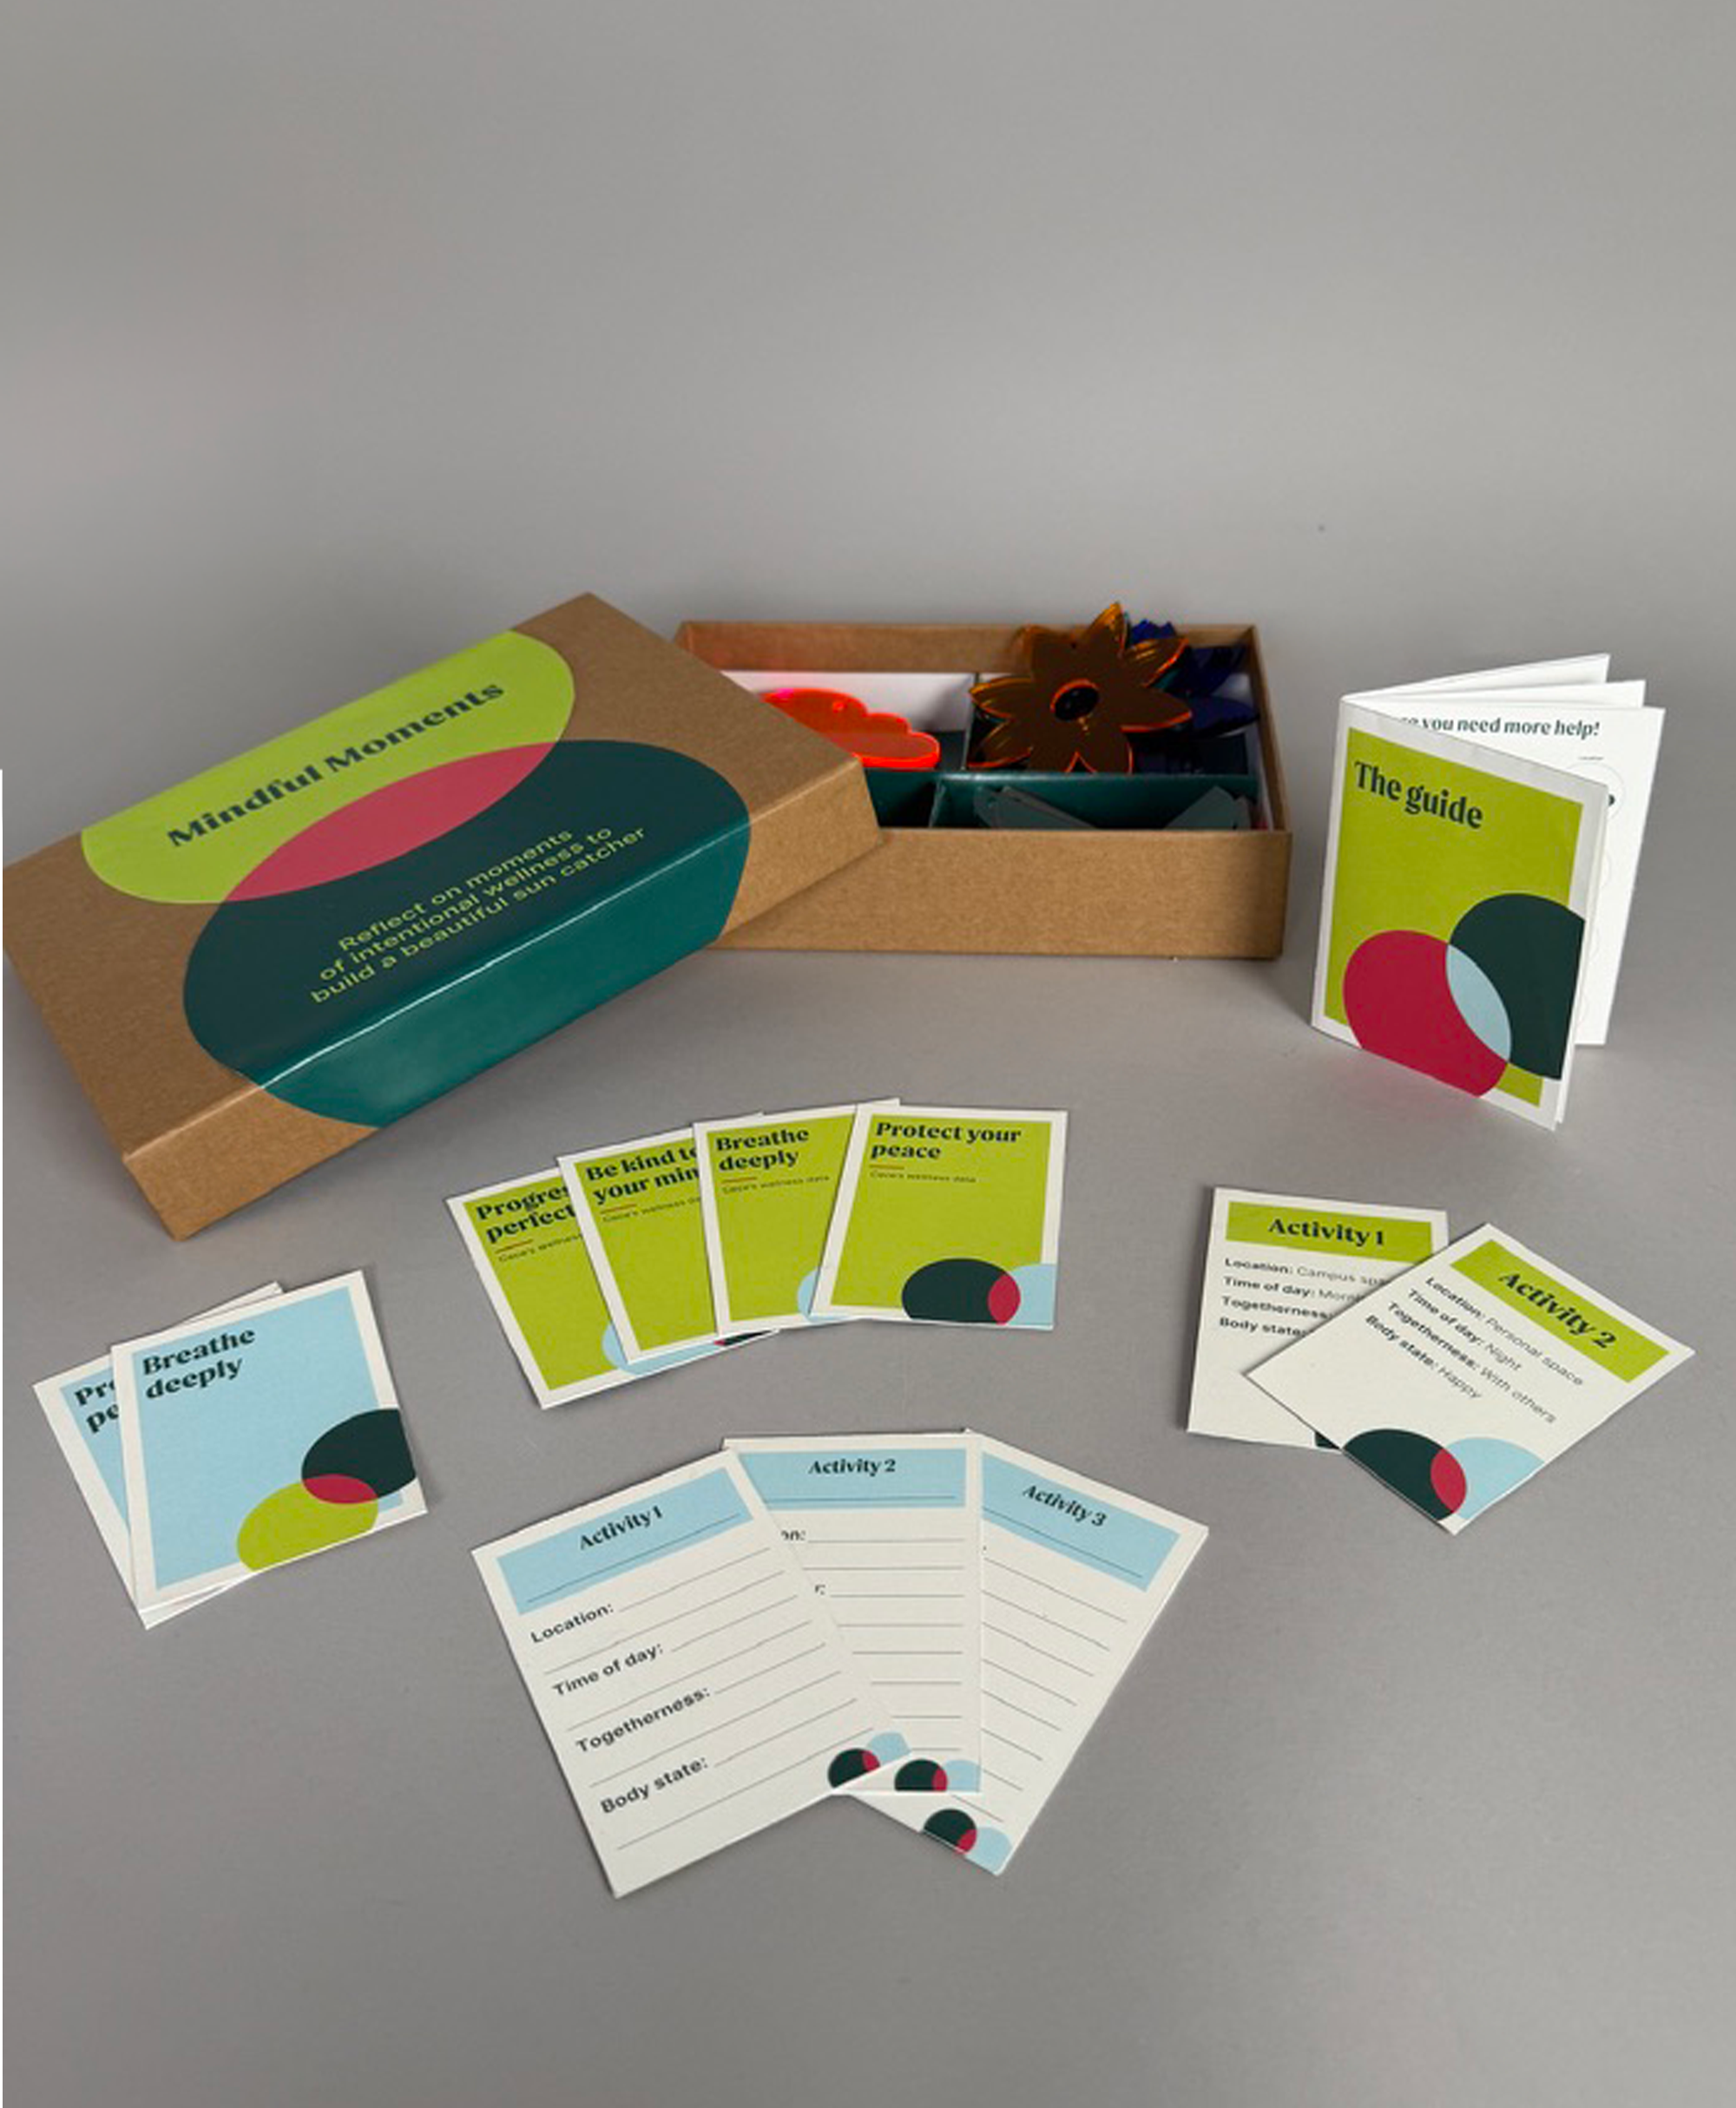
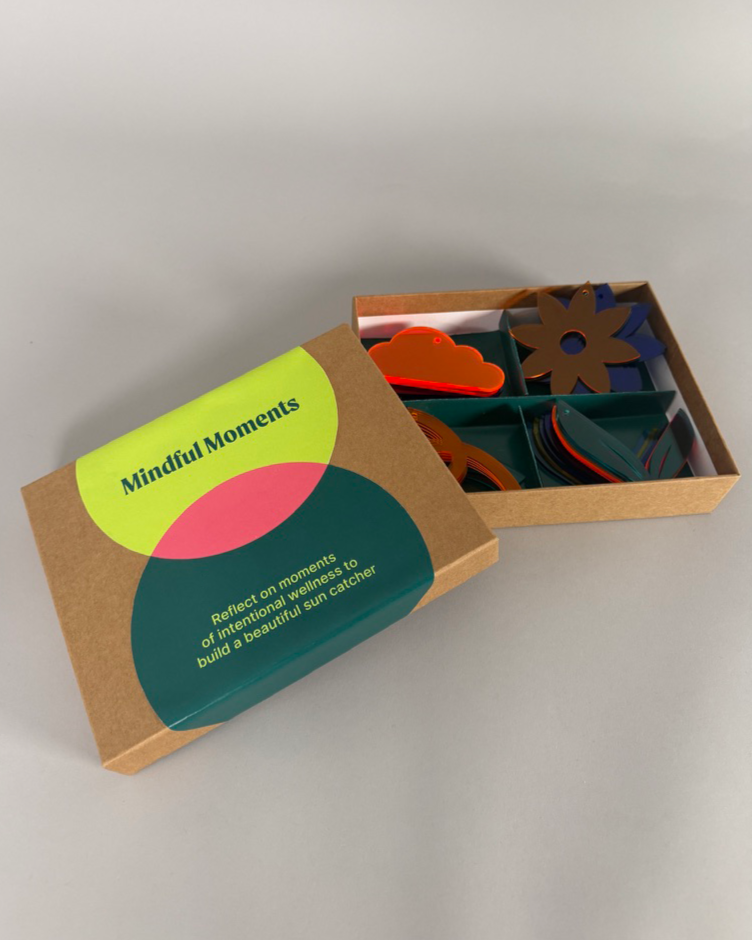
Final Outcome
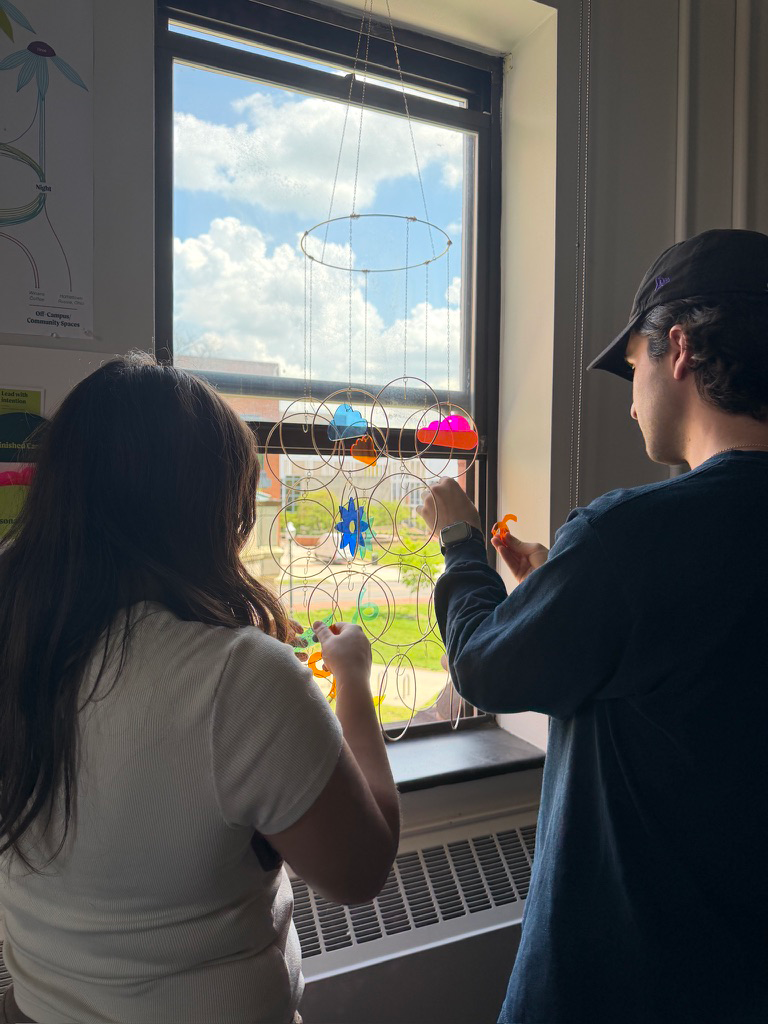
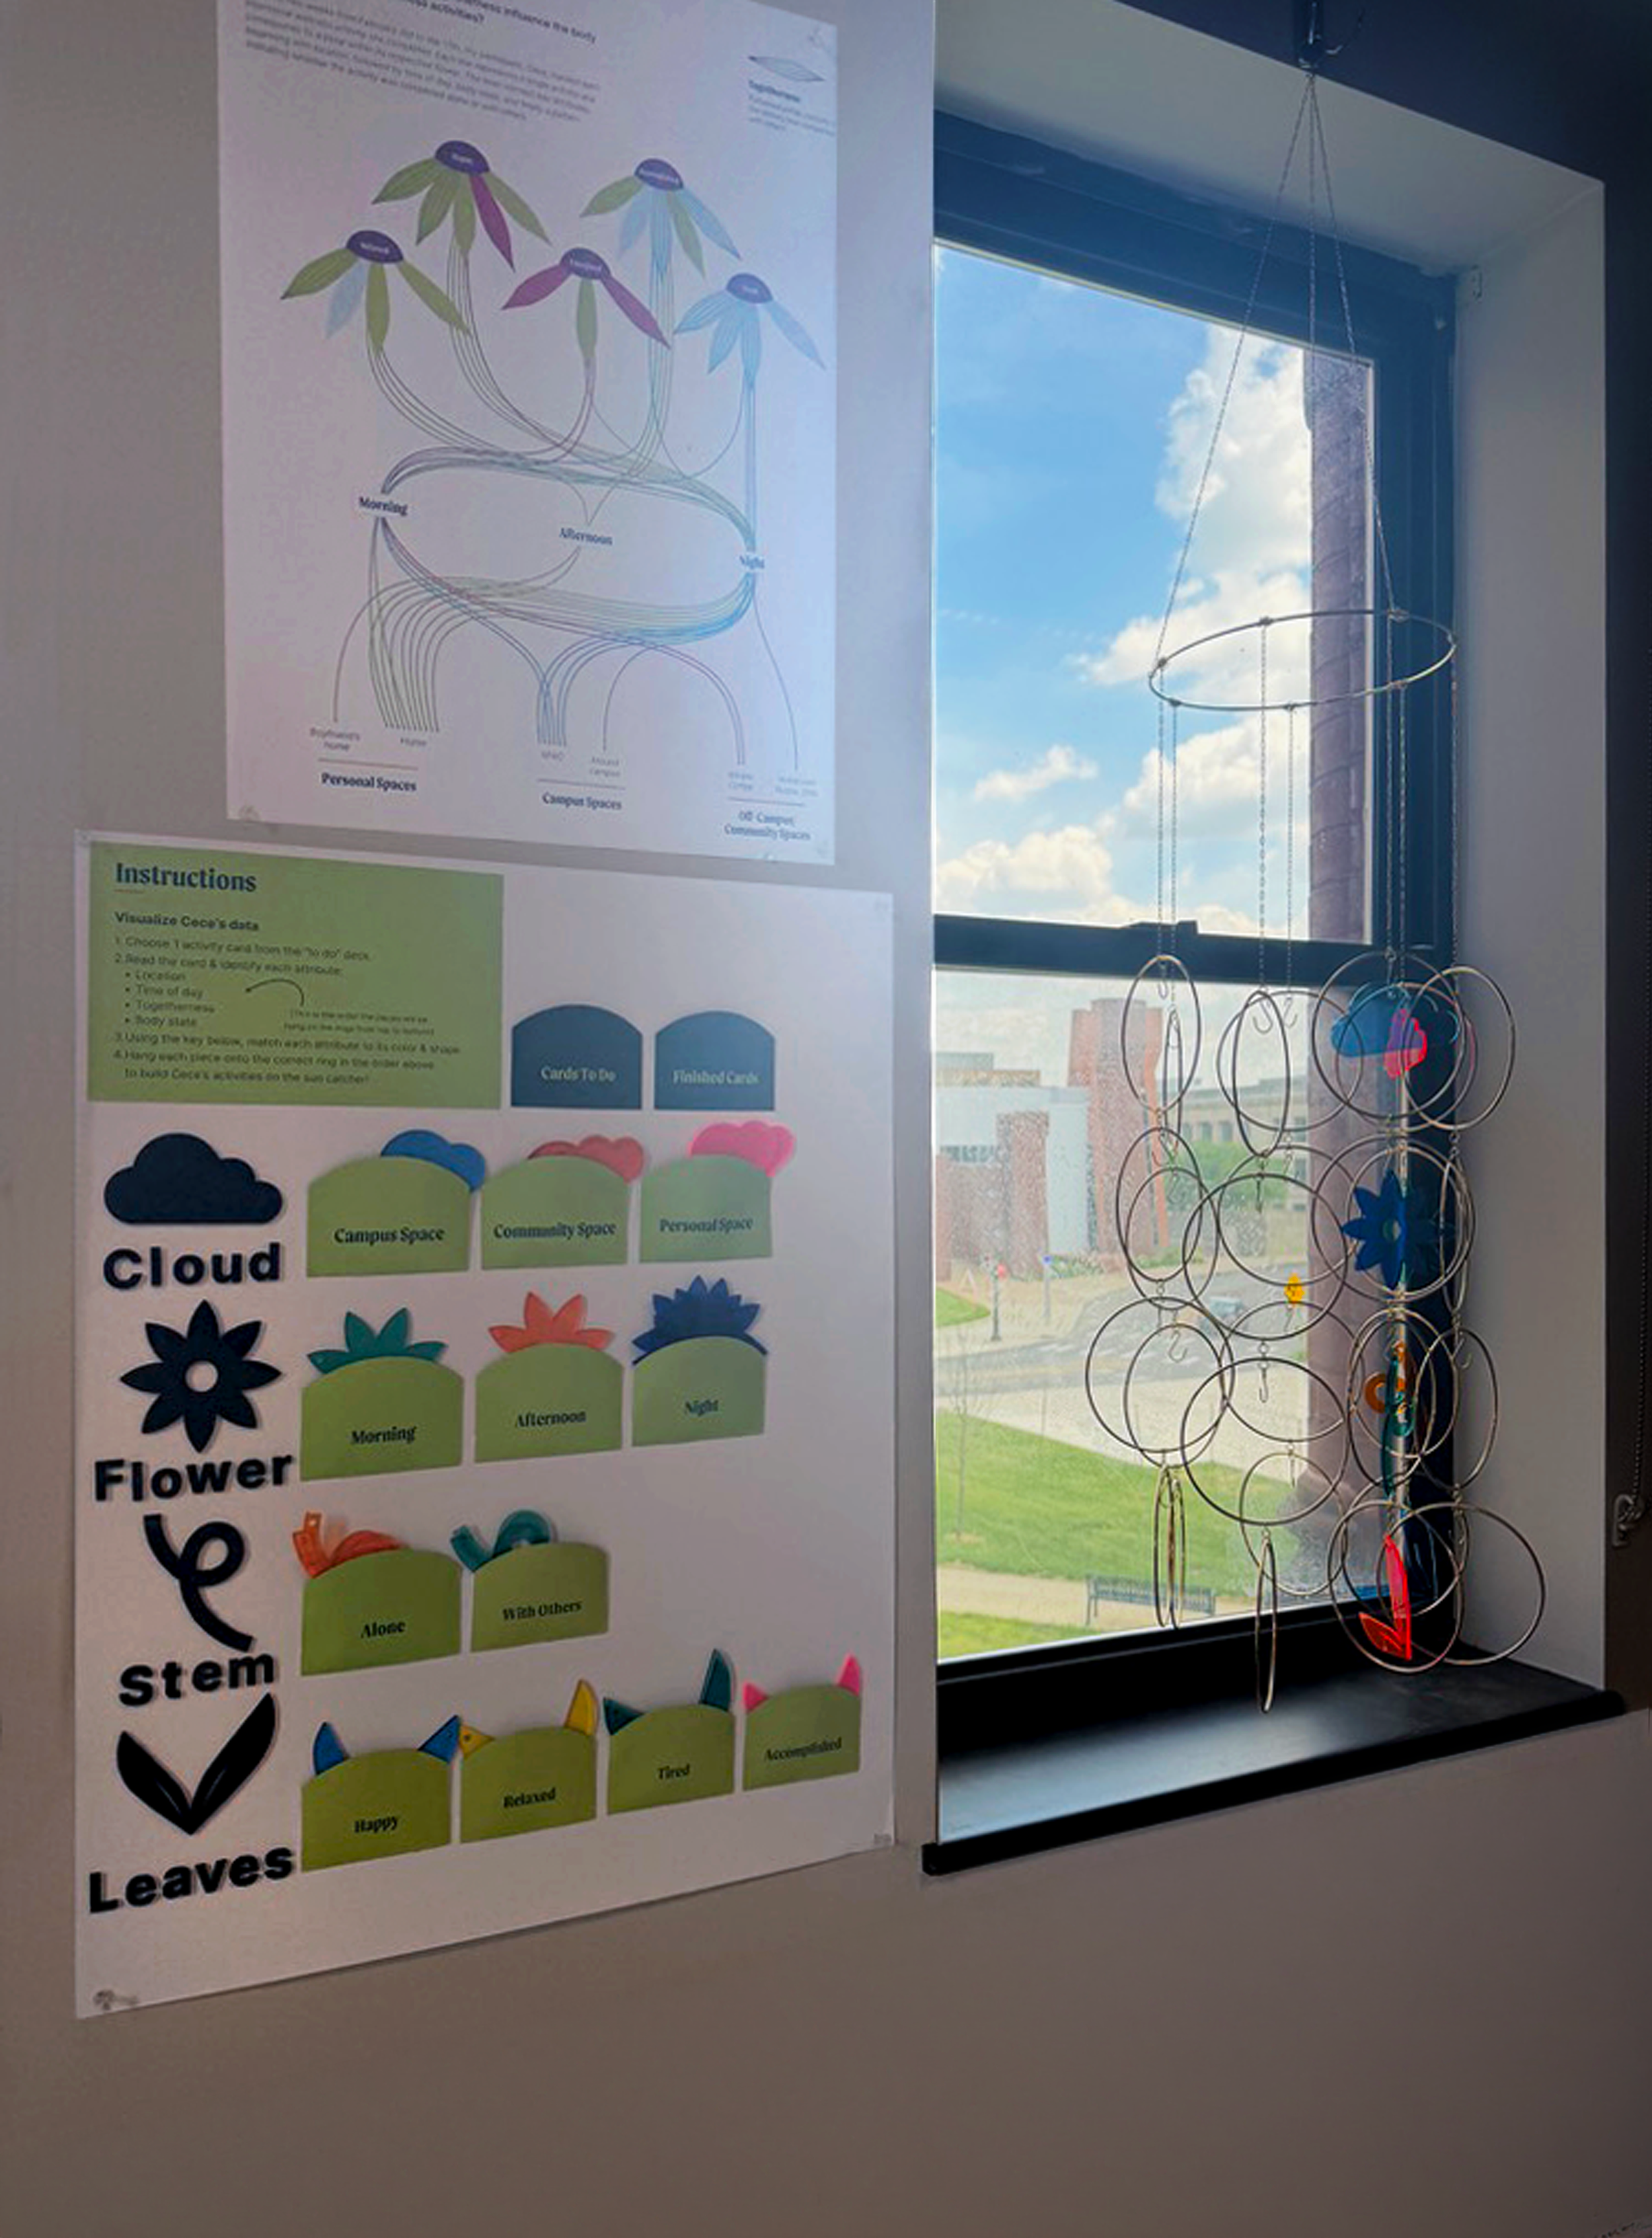
The final outcome is a participatory hanging sun catcher that prompts participants to visualize recorded wellness data and translate it into a physical composition. For the class demonstration, the completed sun catcher was displayed alongside a poster with instructions and all attribute pieces required to build Cece’s wellness data, allowing for clear reference and understanding. While the in-class setup focused solely on reconstructing Cece’s dataset, the experience is designed to extend beyond the classroom. In independent use, interaction participants can either build Cece’s sun catcher or create their own using the accompanying guidebook, which clarifies the attributes and provides step-by-step instructions.
The physical outcome shifts the data from analytical reading to embodied experience, where understanding happens through interaction rather than direct interpretation. The translucent pieces allow light to refract and mix, creating different color interactions depending on which components are hung. This shifting visual experience introduces space, light, and movement as active parts of how the data is interpreted, making the system feel more dynamic and experiential.

Challenges
A key challenge was translating a complex, multi-variable dataset into an intuitive visual system. Early versions felt disconnected and confusing. By strategically selecting which data to represent and being intentional with the activity components, I developed a clear system that feels intuitive and can be adapted for multiple uses.
Learning Moments
This project strengthened my ability to translate qualitative data into a structured visual system while preserving emotional depth. I developed a stronger understanding of how hierarchy, consistency, and clarity impact user experience across static and interactive mediums. I also improved my skills in overall data visualization, system design, and prototyping across both digital and physical media.
Future Directions
This project could be expanded to represent a wider range of wellness moments; currently it only accommodates seven entries, which is about a third of my participant’s total data. I would also improve the overall system to make participation more seamless and intuitive for any user. Finally, I would explore elevating the aesthetic quality so that, once completed, it could function as a more permanent displayable piece.